
5 Charts to Find the Bottom in this Market!
It's coming in hot.

For the first time ever, Saylor and his Strategy sold Bitcoin. They did this to fund their preferred dividends. People that hold STRC get paid 12% yield. That yield now comes from selling Bitcoin.
Saylor only sold 32 Bitcoin, but it was enough to send the price crashing almost 10% this week. Considering his 840k BTC holding, this move cost him $6 billion.
With this news, it seems Bitcoin will find a bottom much sooner. Time to look at 5 key charts that will help you time the bottom. Scroll down.
Join the private beta of NADO to farm the next DEX airdrop! Limited invites available for YCC members.
It was only a matter of time until Saylor’s financial alchemy called “Strategy” would lead him to sell Bitcoin. Not surprised to see him do this in the midst of a bear market.
He’s got bills to pay in the form of monthly yields to his preferred stock holders.
Since MicroStrategy generates no revenue on its Bitcoin holding, the yield can only come from one source.
Selling Bitcoin.

At this point, MSTR and its strategy smell like the biggest ponzi in crypto and mirrors the Terra Luna UST ponzi. I also posted about it here on X.
The problem is that when this pyramid will unravel, Bitcoin’s price will suffer, a lot. It already crashed 10% only on the idea that Saylor can and is willing to sell Bitcoin.
Still, this may provide a generational entry to buy more Bitcoin. Below, 5 charts to guide you in the coming months.
1. Bitcoin Price Chart
This is the third time Bitcoin formed an ascending channel only to break below it. This pattern was bearish from the start and I covered that in my Alpha Posts several times.
The expectation here is a re-test of the lows around 60k. It’s likely that support level won’t hold and Bitcoin will make new lows. If we measure the previous drop and add it to this last formation, the price lands exactly on 50k.
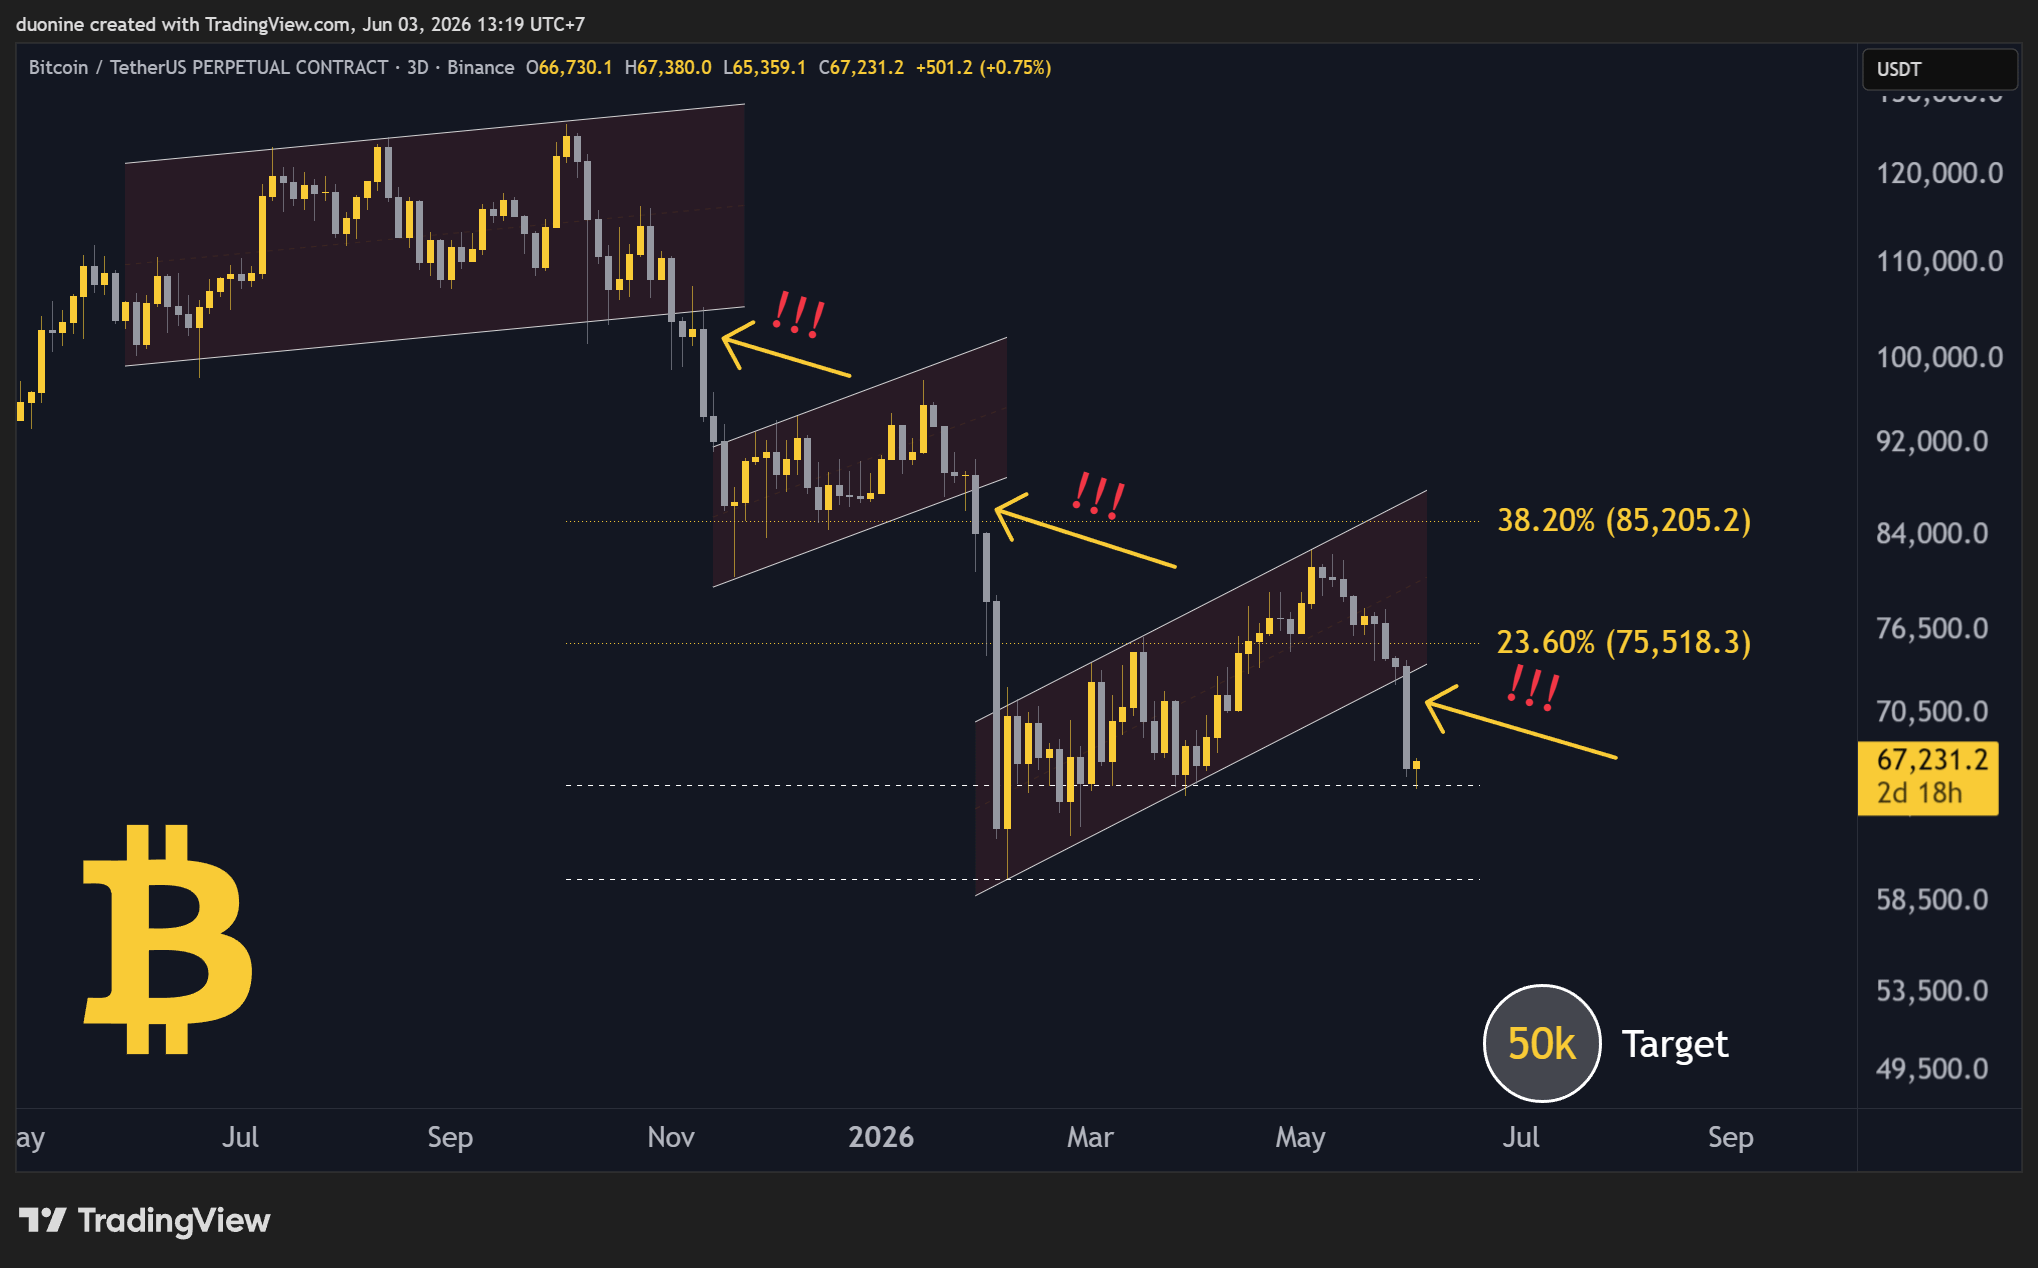
I believe a price around 50k and below is a trigger to dollar-cost average (DCA) into Bitcoin. The prime buy area is between 50k and 30k. We don’t know where Bitcoin will bottom, but I believe this drop may be the last one or second to last.
2. USDT Market Cap
In the past two weeks, the USDT market cap decreased by almost $2 billion. That’s liquidity that has left the crypto space. This is extremely bearish and a key signal in a bear market.
In the below chart, I’m presenting the USDT market cap MACD indicator on the monthly timeframe. The last time we had a bearish cross, the bear market lasted for another eight months before Bitcoin started to grind higher. That aligns with my expectations that 2026 remains a bearish year and bulls return in 2027.
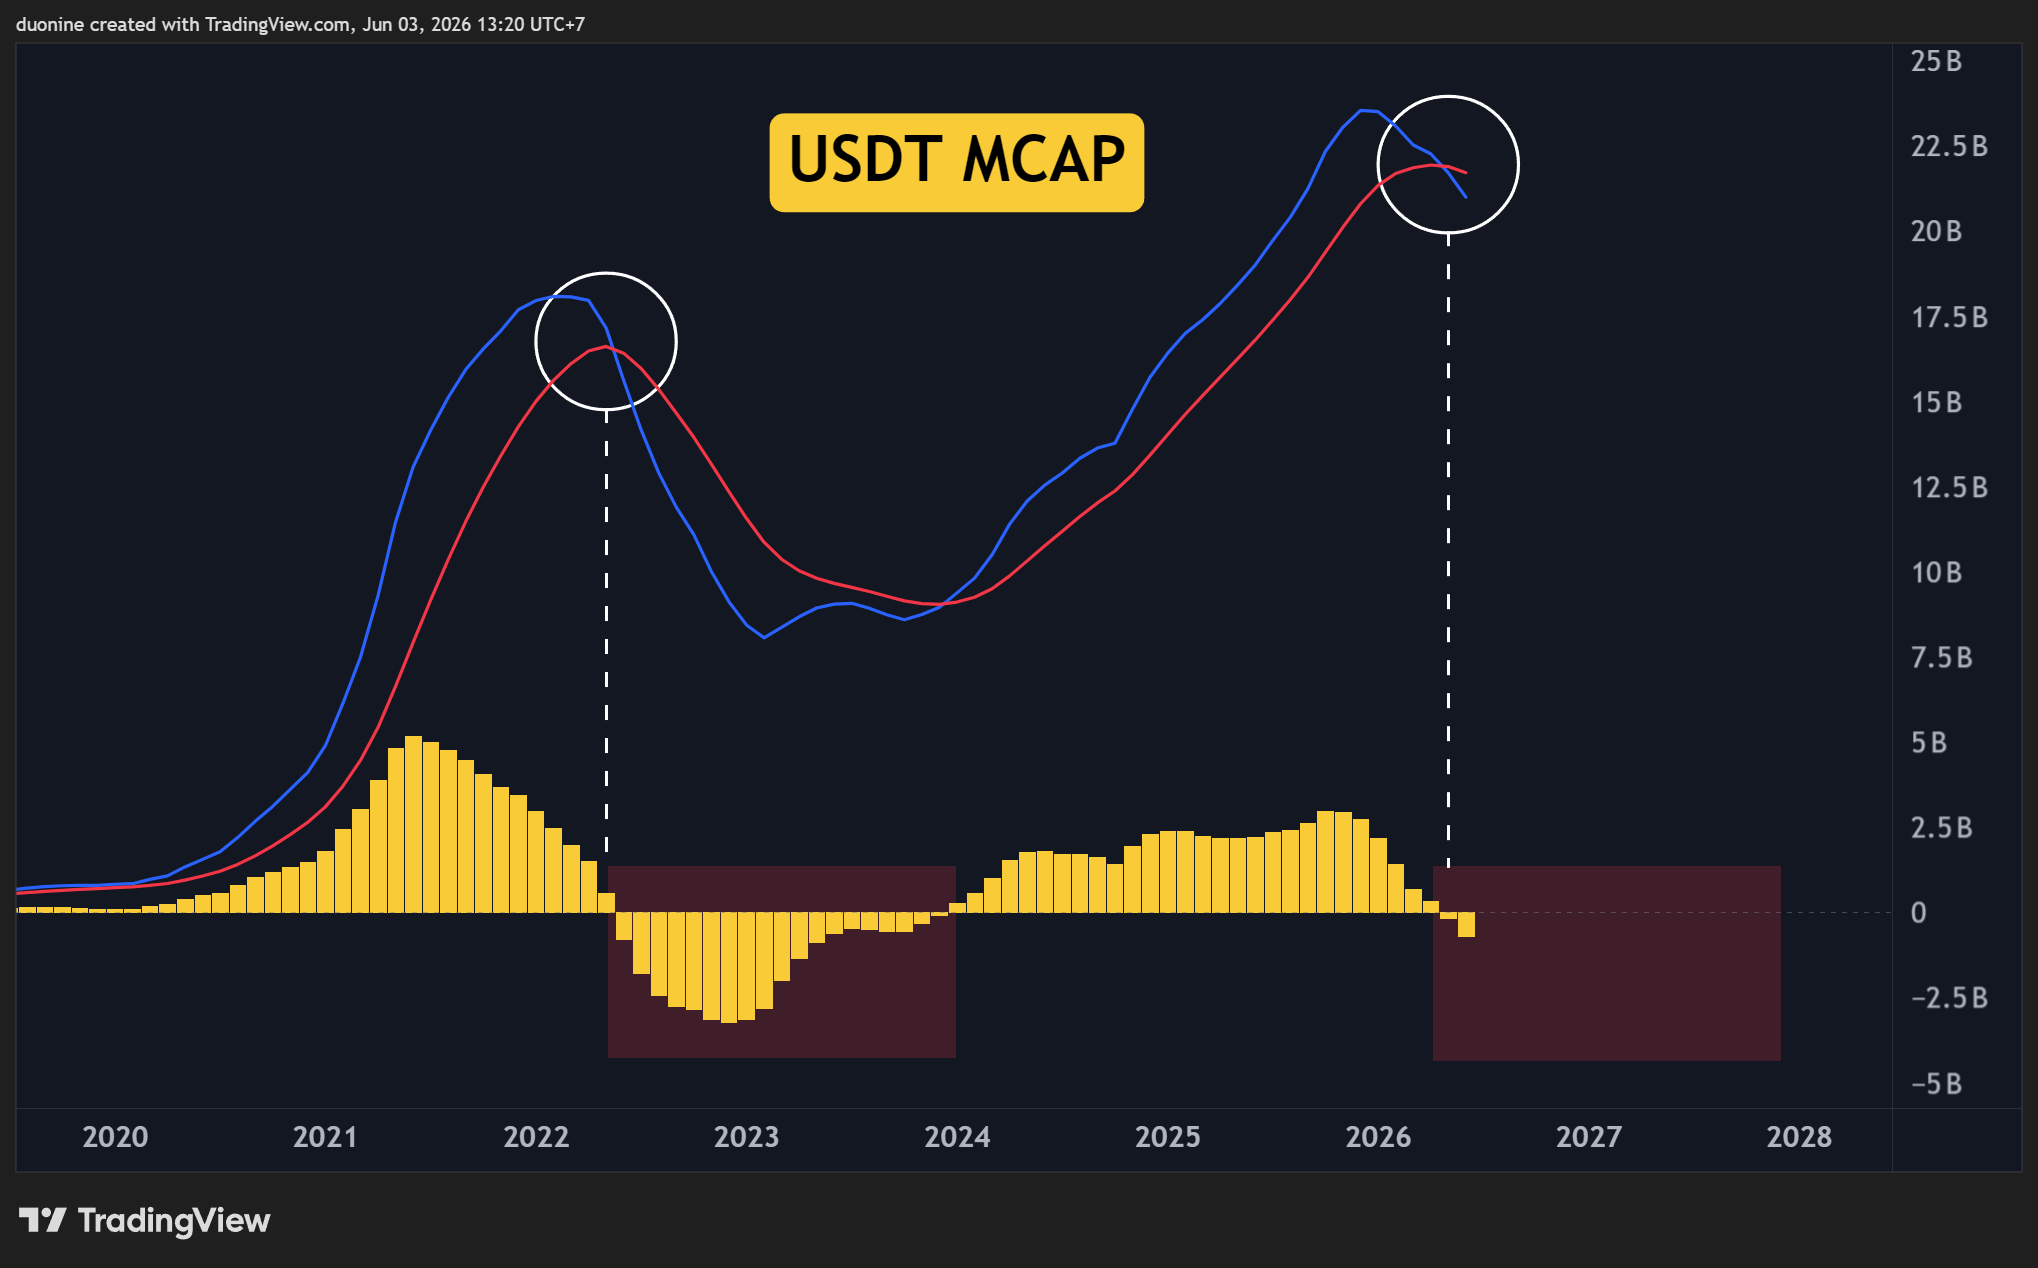
Limiting the analysis to this chart, you want to wait as long as the USDT MACD histogram (the yellow bars) makes lower lows. As soon as that trend starts to reverse and the MACD histogram starts moving up again with higher lows, you want to start buying Bitcoin.
You can also speculate and buy earlier as soon as the histogram is losing momentum during its downtrend. That can be done by measuring the height of each monthly histogram bar. As soon as the difference between months falls and gets smaller, it’s a good signal to buy. That shows sellers are getting exhausted.
3. USDT + USDC Dominance
Another way to look at the market is to measure the dominance of USDC and USDC market caps vs all other crypto assets. In a bear market, the dominance of stablecoins increases as Bitcoin and other altcoins bleed lower.
As expected, this chart has been in an uptrend since late 2025 when the proper bear market started. Historically, this chart topped anywhere around 15%. At the time of this post, we’re around 11.5%. Still some room left to go.
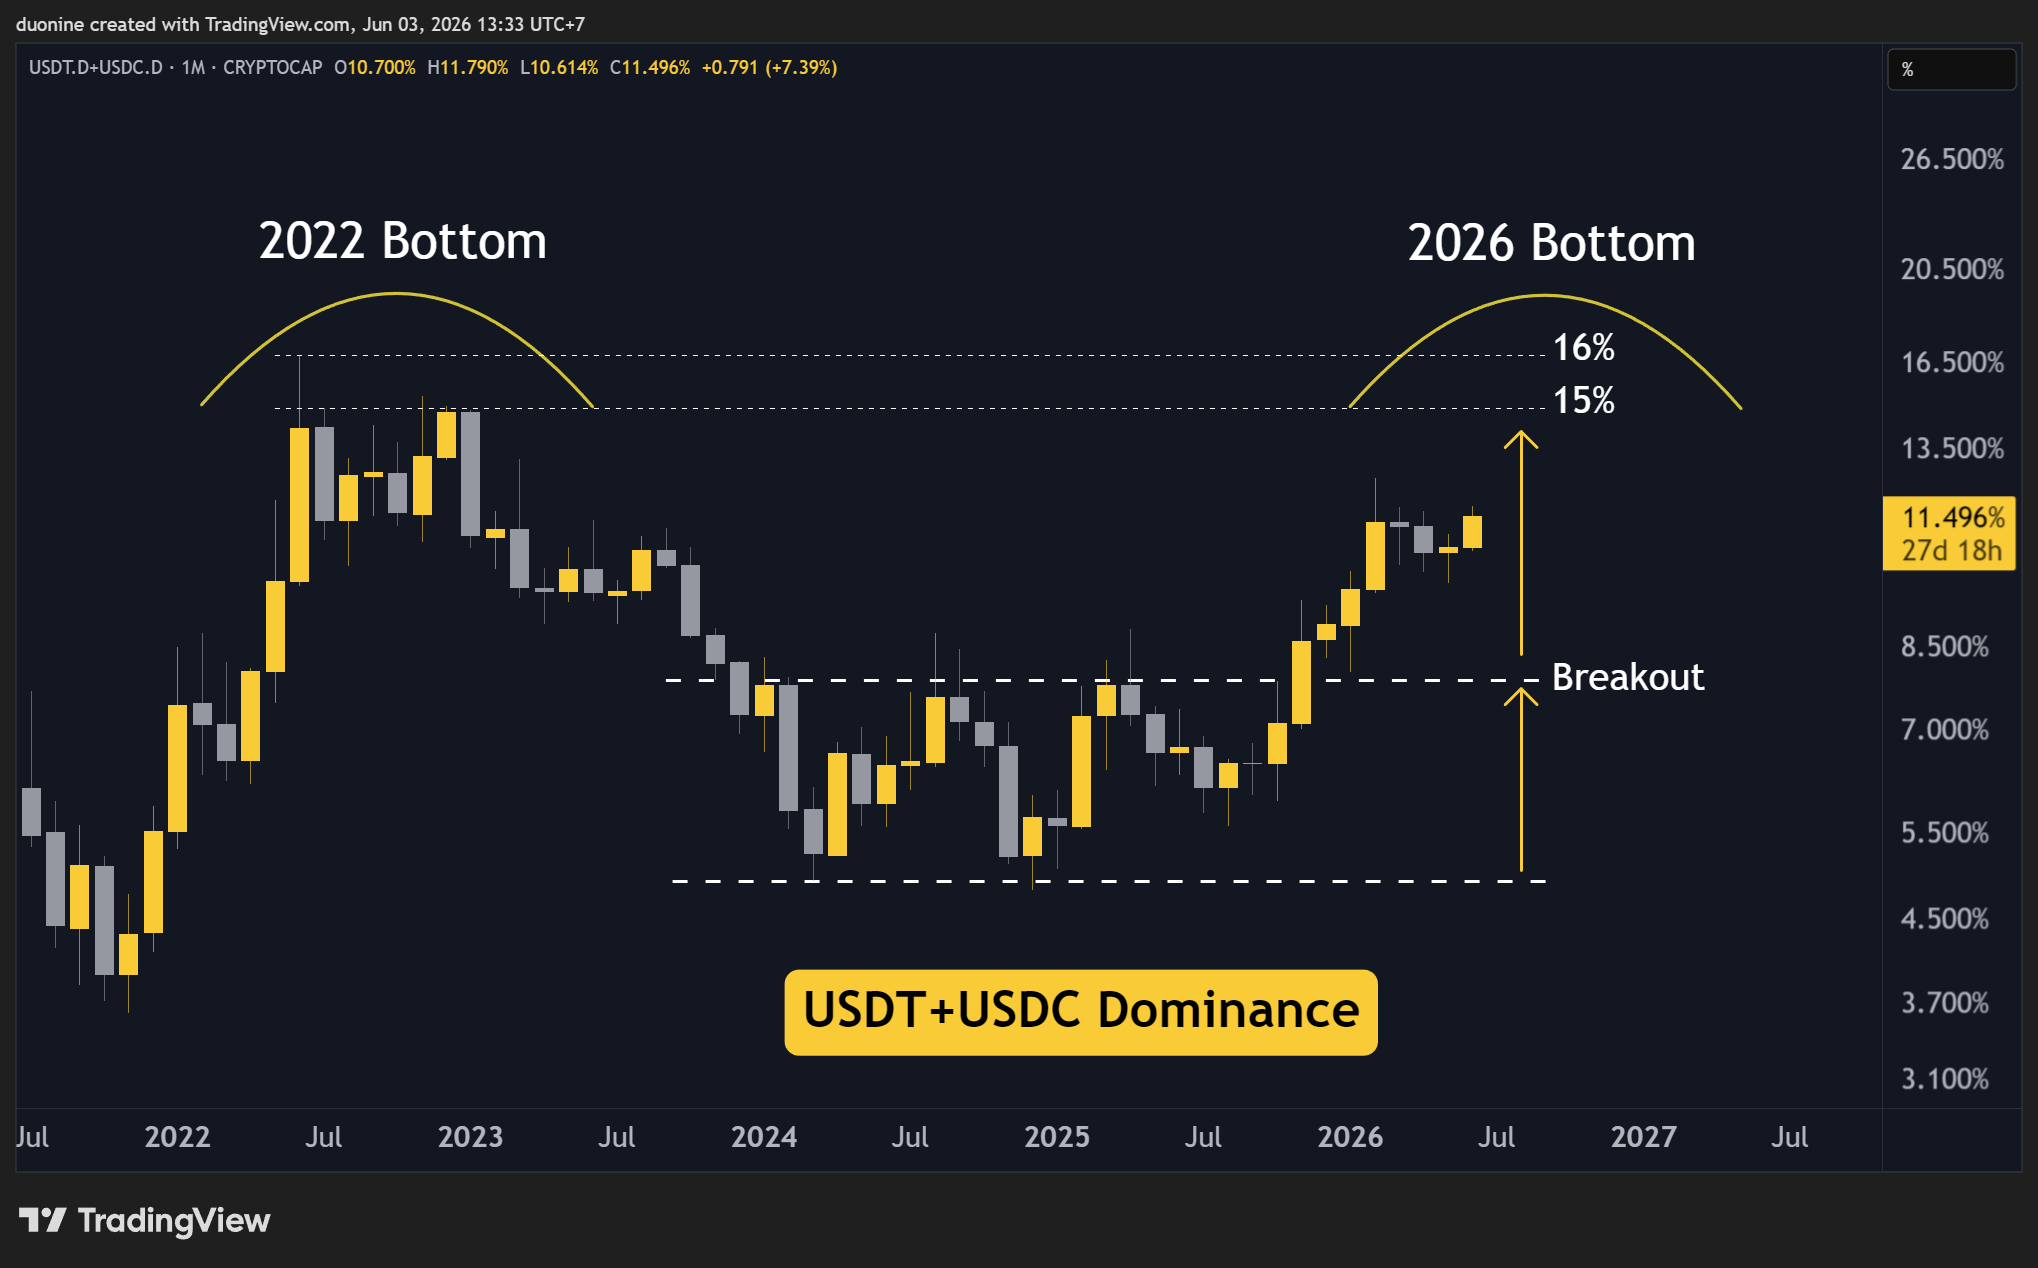
You want to buy Bitcoin and other crypto assets when the stablecoin dominance hits a plateau like in 2022. Buying in that zone should provide an optimal risk/reward entry. Keep an eye on that 15% resistance, especially if it aligns with the other charts at the same time.
Enjoying this article? Subscribe for exclusive market alpha and join our USDai team to farm the Season 2 CHIP airdrop!
4. BTC/Gold Ratio
The Bitcoin & Gold ratio was one of the best indicators for this cycle top. It will likely also be a prime signal for the bottom. As you can see on the chart, we had a short relief rally between March and May and now the downtrend is resuming.
I’d expect new lows here similar to the Bitcoin price chart. Nevertheless, as soon as this ratio falls into the blue box it’s probably good to start DCA with orders going all the way down to 9.
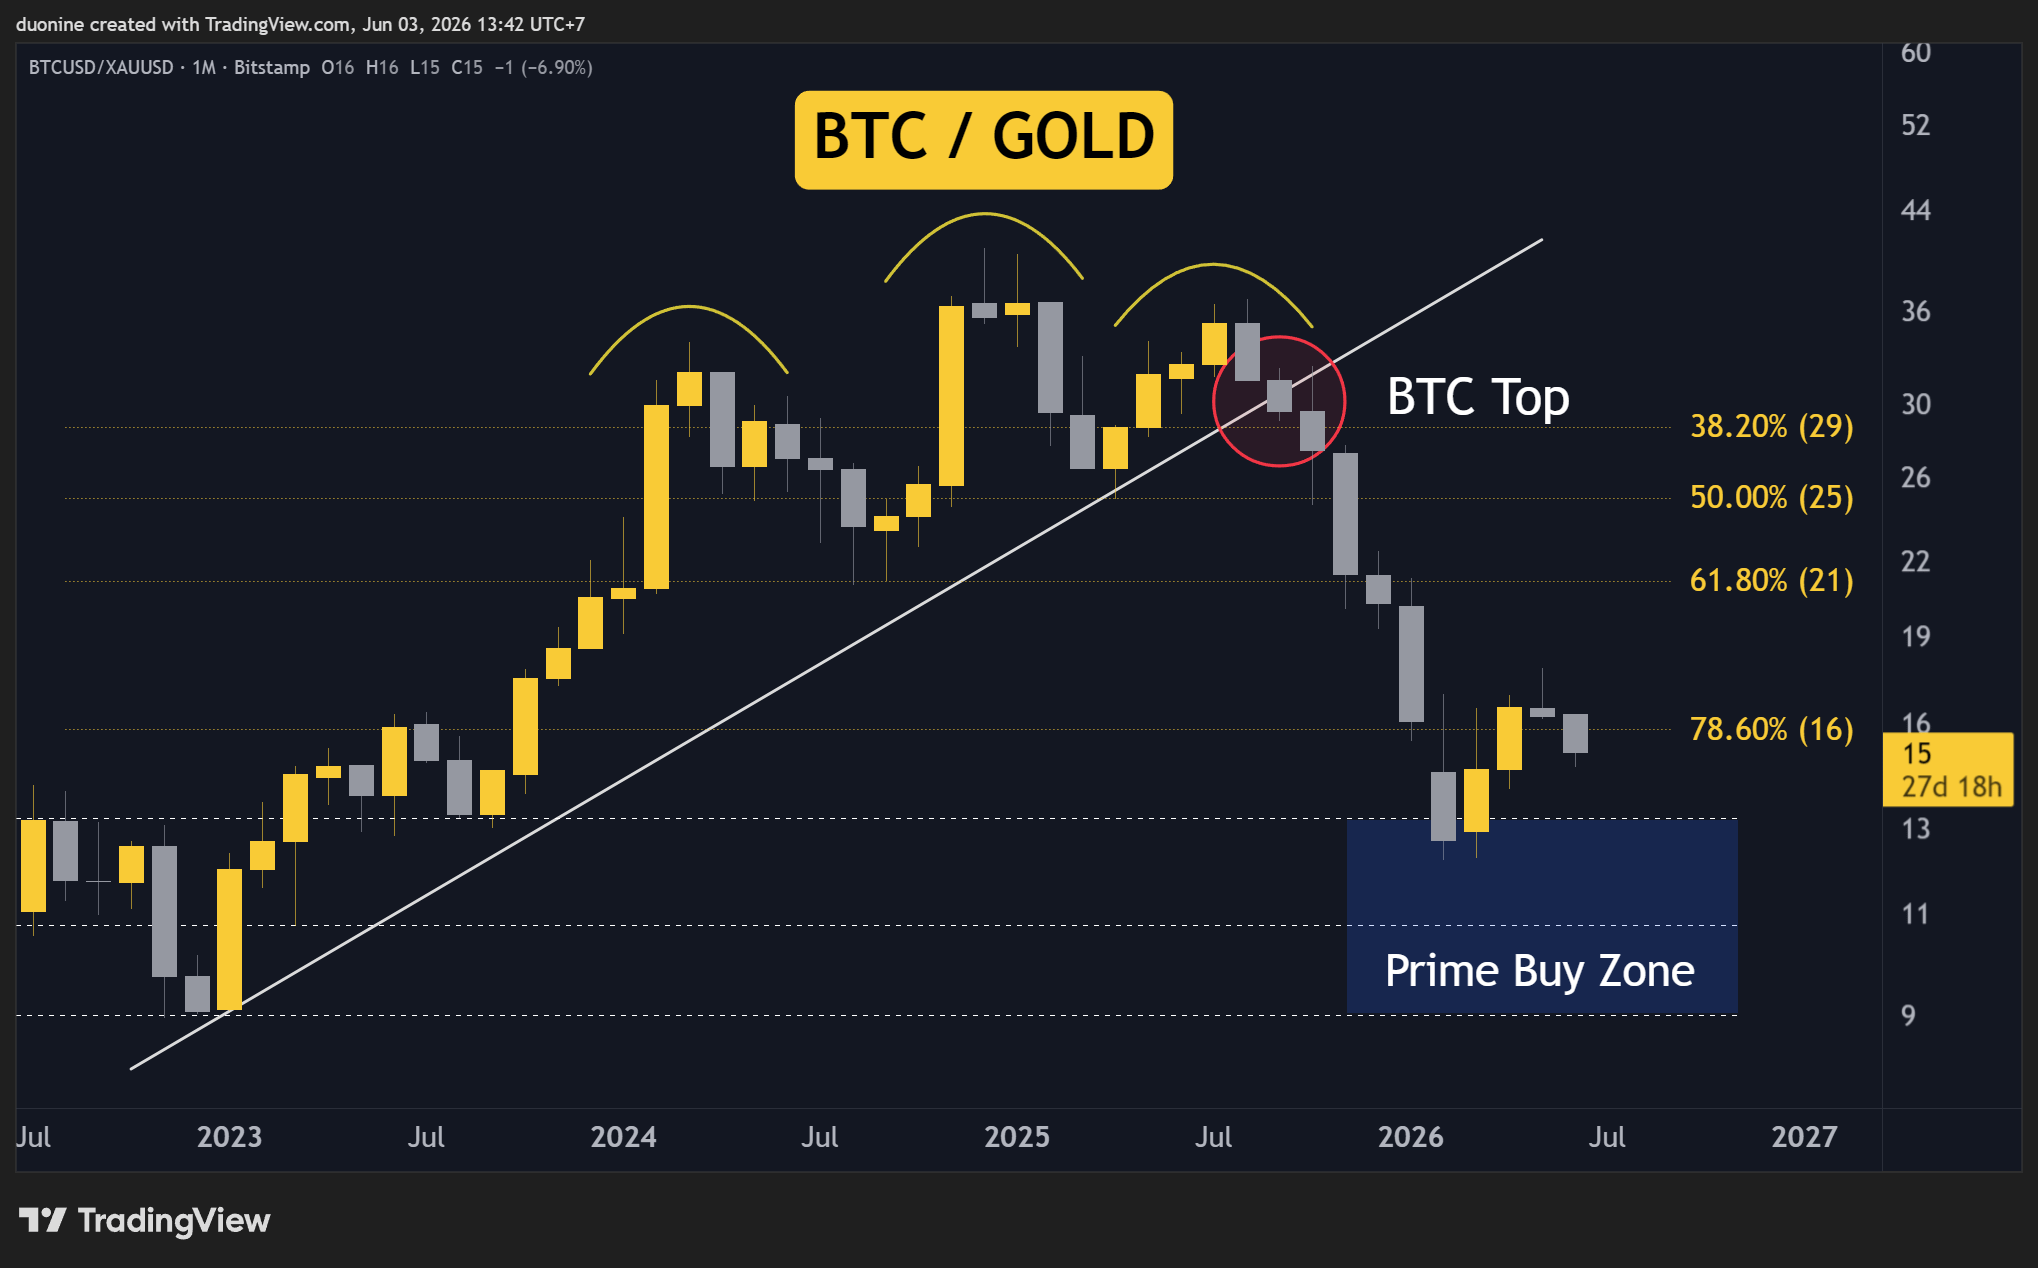
The reason you want to buy into that box is because, in the past, that was the area where Bitcoin found support and started its next major bull market. However, there is no rush to buy since Bitcoin may stay in that box for months before it leaves.
5. Total Crypto Market Dominance
Notice how the chart on total crypto market dominance mirrors the BTC/Gold ratio. Same candle pattern. This is interesting and builds up confluence or confidence into this analysis.
Similarly, you want to speculate entries in the blue box. Wait for lower lows and then signs of sellers exhaustion (like the histogram point on USDT MACD above).
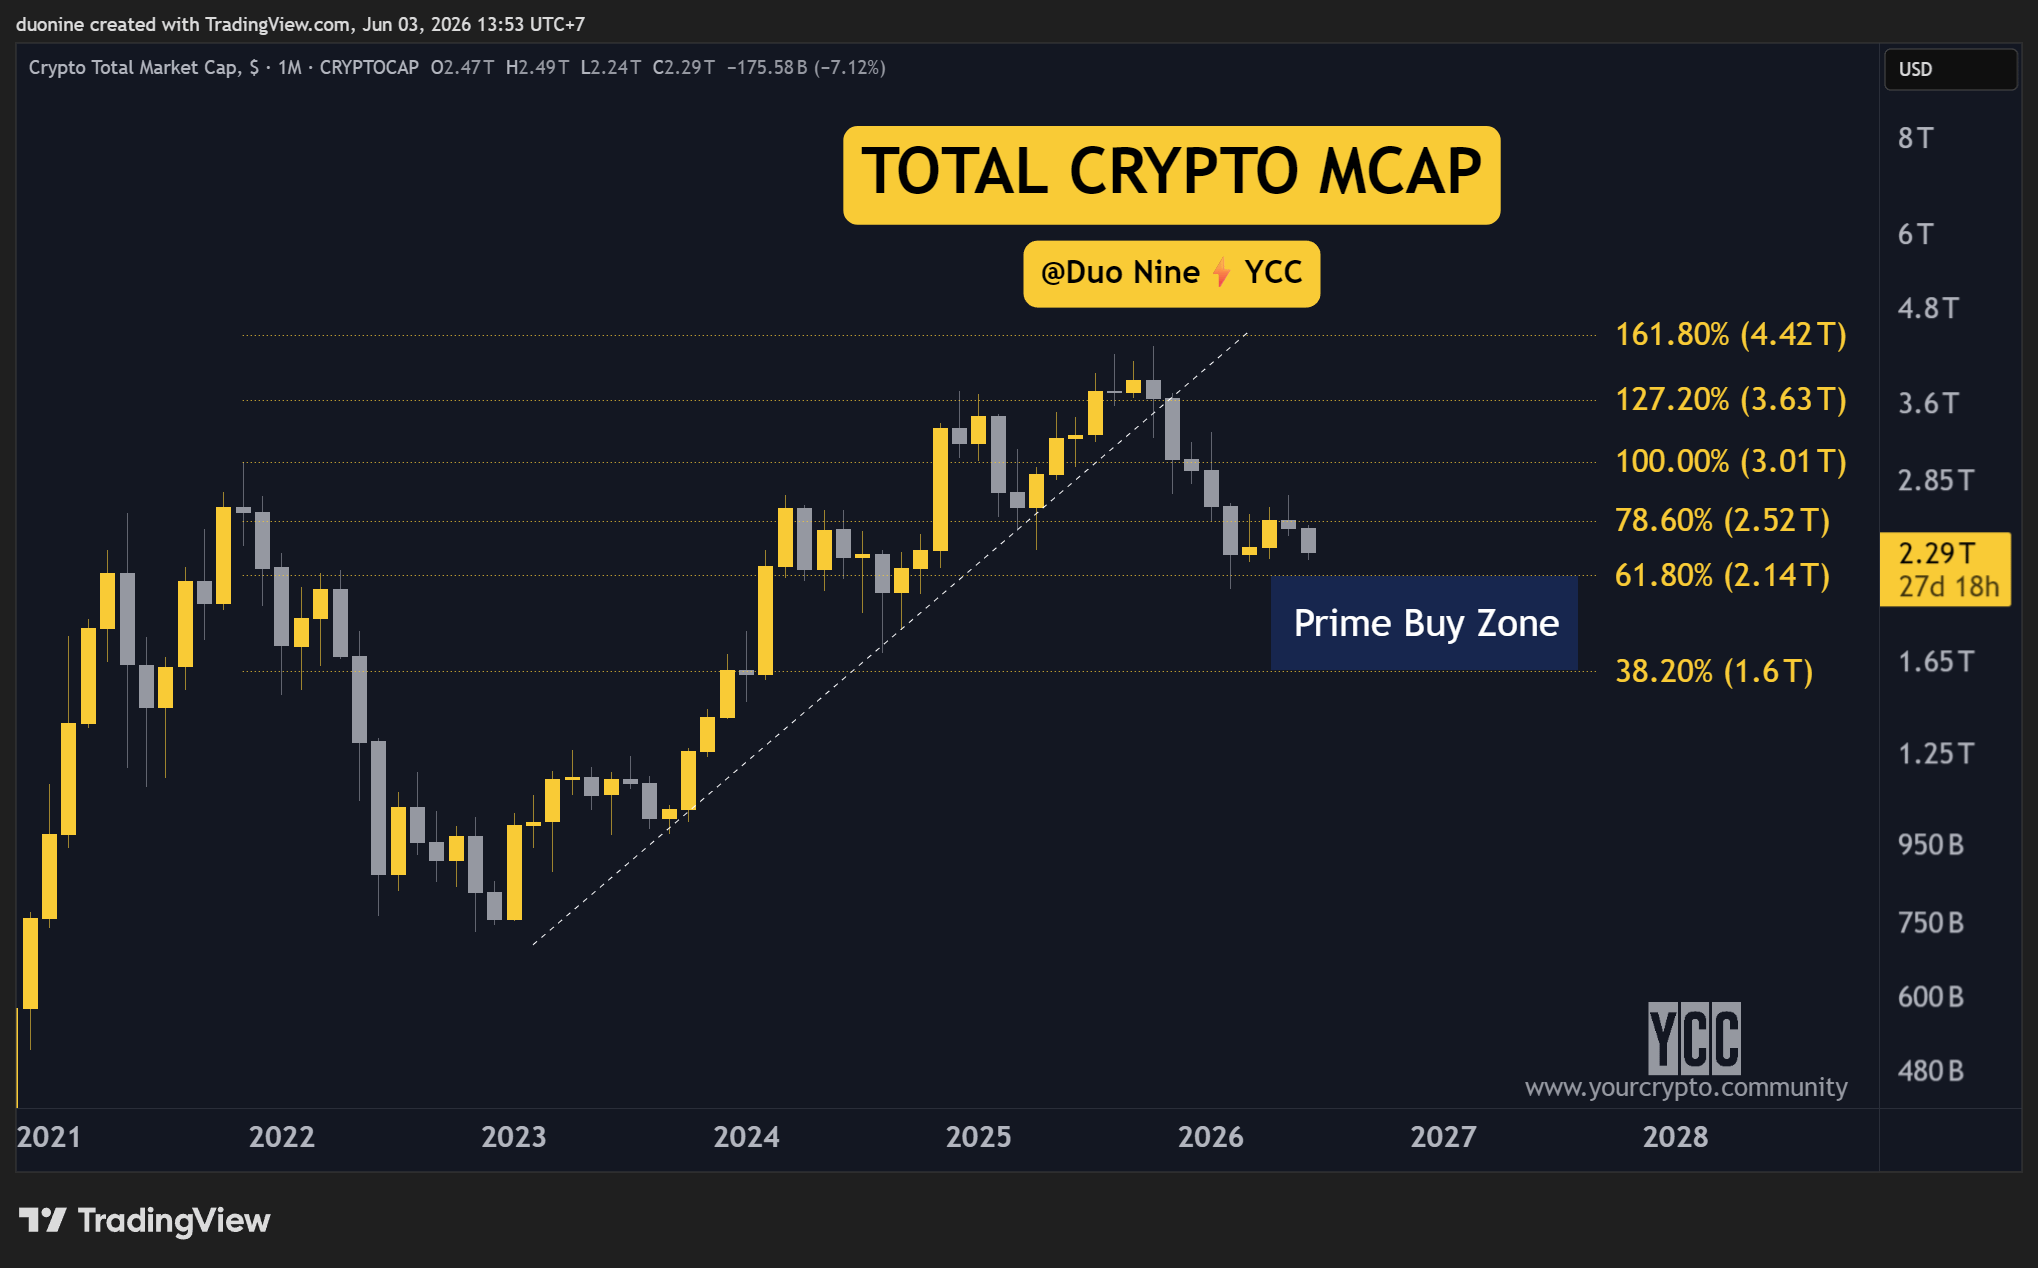
Either way, you can also use a time stop or limit. Regardless of where the Bitcoin price will land, you want to be a buyer in the last few months of 2026. That means a prime buy period could end up being October to December.
Alternatively, you can wait to buy in early 2027. By then, charts should look ready for a reversal and a new bull market. That works well if you aim to buy strength rather than speculate on the exact bottom.
Parting words
Which of the above charts is your favorite and why?
I aim to load up on Bitcoin later this year. If you plan to buy altcoins, it may also be a good opportunity, but notice that some alts like HYPE or ZEC had their own mini bull market in 2026 while everything else was in red.
Coins that already pumped will likely underperform once Bitcoin starts moving since they are in different market cycle. Make sure to judge each coin on its own individual chart before any macro bias you may have.
This newsletter is made possible with the generous support of our Patrons and partners. Upgrade your experience by becoming a Patron for lifetime access to our exclusive alpha! All info is provided for educational purposes only and is not financial advice.