
Biggest Crypto Crash in Years: 10 Charts to Find the Bottom!
This bear market just showed its teeth. Don't get chopped and follow this guide.

In the past three weeks, Bitcoin crashed almost 40%. This is one of the fastest drops on record. Percentage wise, this is pretty standard for a bear market. However, the speed of this crash caught many off guard.
I expect a bottom within six months, maybe even faster if this accelerated rate of descent is maintained. Bottom should be in by October 2026.
In what follows, I’ll explore with you 10 Bitcoin charts that can help you time the bottom. When we’re there, buy hard. I don’t think Bitcoin will stay low long based on this price action.
Become a Patron for lifetime access to our exclusive private alpha!

Long Term Holder Realized Price
The first chart I want to show you is the long term holder realized price that calculates the average price at which long-term investors have purchased their Bitcoin, taking into account only those coins that have not moved for a significant period (155 days or more).
The current realized price for such holders is 40k. See the chart.
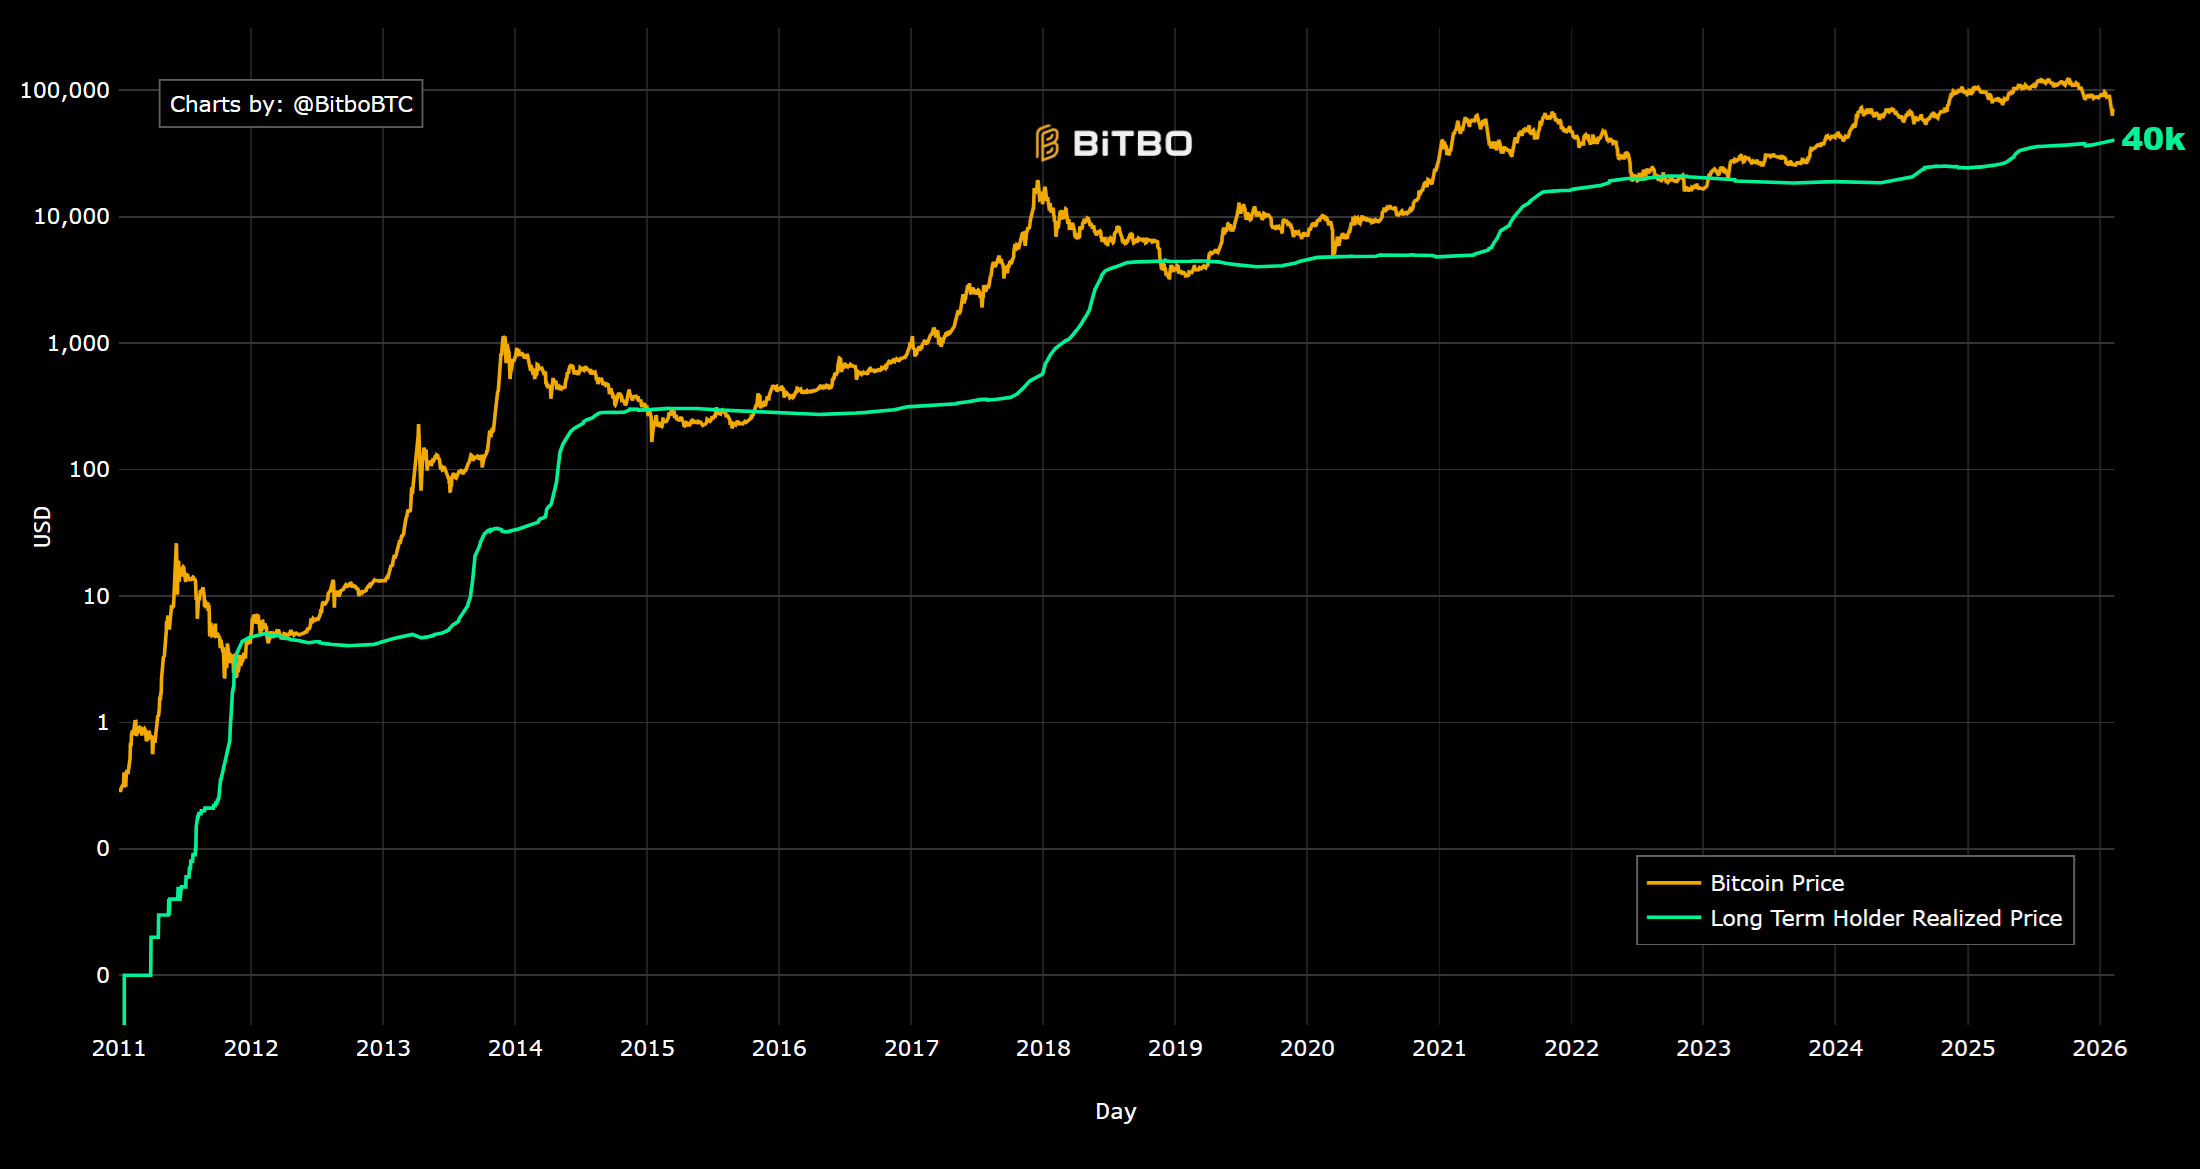
As you can see, any price under 40k will likely trigger long term holders to buy more and begin the reversal process in this downtrend. Any price under 40k is also a buy signal in my book.
I will personally start dollar-cost averaging into Bitcoin once it falls under 50k with the lowest price level I expect around 30k. I find a price at 30k or under unlikely, but never dismiss a wick down there. Be ready to catch it with limit orders.
Historically, any buys under the long term holder realized price was an excellent entry. No reason for this cycle to be different. It would also place BTC in a 70% correction. Pretty similar to the past.
Bear Bands
This chart was posted on X by CryptoCon_ and caught my eyes because when he first posted it people laughed at him. They ain’t laughing now. His first target for January - March was hit perfectly at around 60k.
Click on each image to make it larger. The first was his original prediction and the second is a detailed view of the current price action.


The next key target is around 40k and is expected by August - October. The lowest target is just under 30k and likely by the end of 2026. I find this prediction a bit more bearish overall, but don’t dismiss it. Plan around it.
Excavo Cycles
Excavo is an old trader that has been active in crypto for over a decade. He posted the below chart back in September 2025 when he told everyone he sold everything because the top was in. He was right.

As you can see, he predicts a bottom around 40k and likely to happen before the end of 2026 or in early 2027. This fits with my own expectations, but I am leaning on Bitcoin finding a bottom faster and most likely before 2026 is over.
Bear Markets Comparison
A look at 2026 vs previous bear markets shows us this crash is a bit faster than 2021 and slower than 2013 or 2017. This projection also implies a bottom around late 2026. Right on target I’d say.
I don’t think Bitcoin falls to 20k or lower, but 30k as the 2021 bear market projection shows in green? Yep, that’s possible.

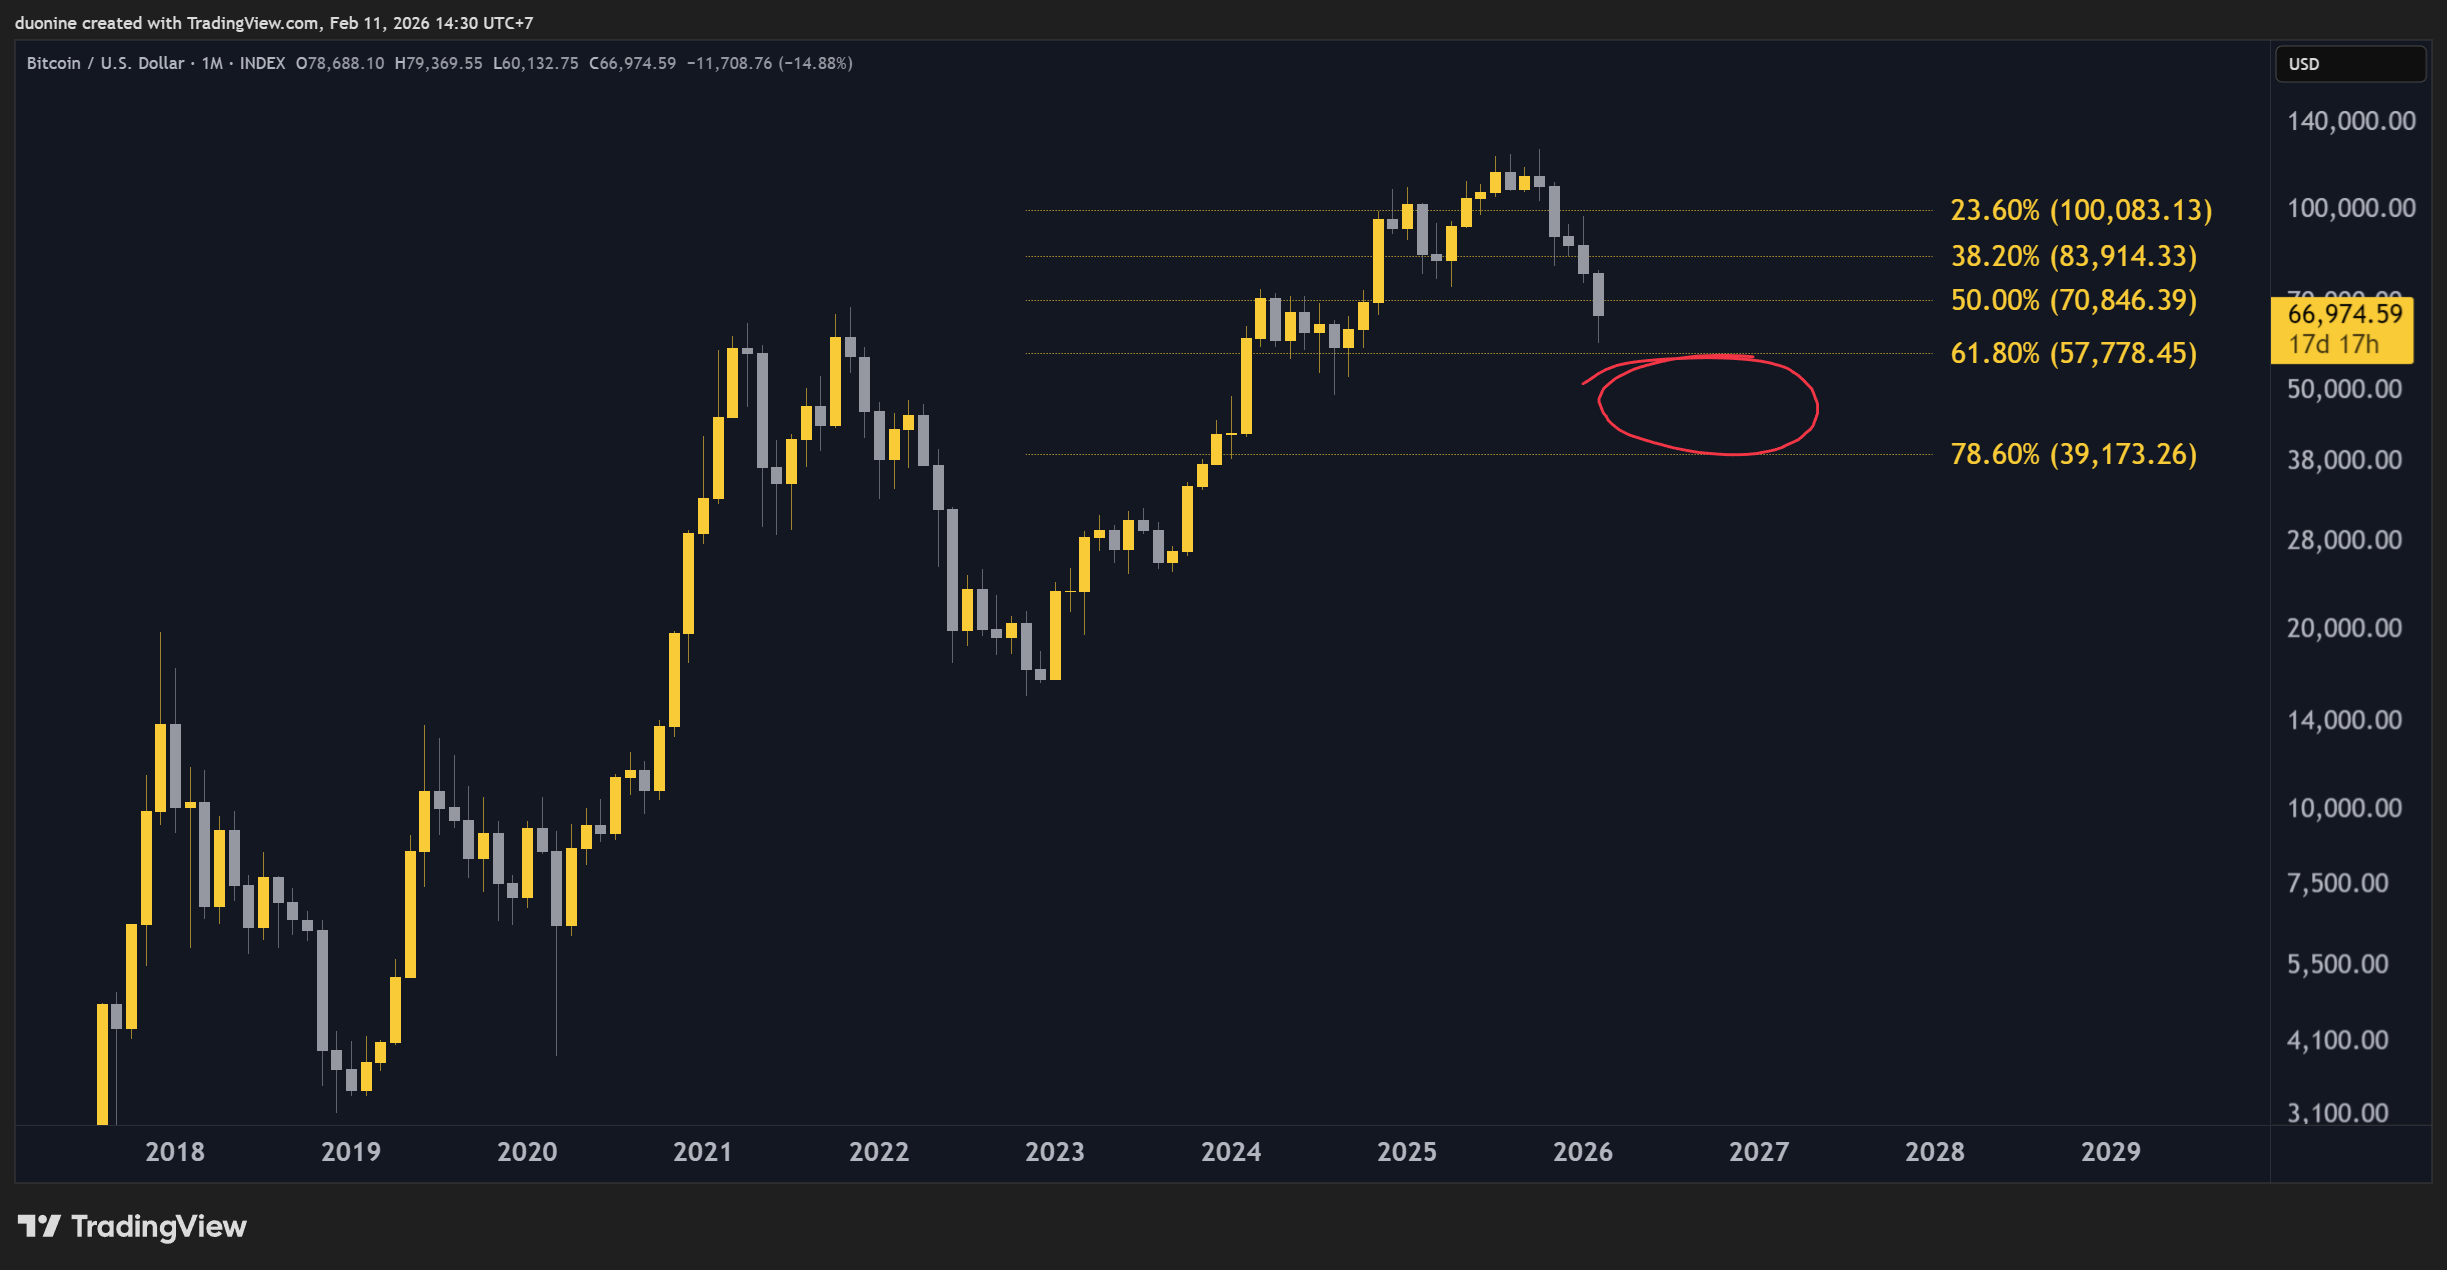
Symmetry to Previous Cycle
Another pertinent point is that this cycle mirrors the last one quite well. This can be seen below. If the price action respects the past, expect a bottom at the 78.6% Fib level or around 40k.

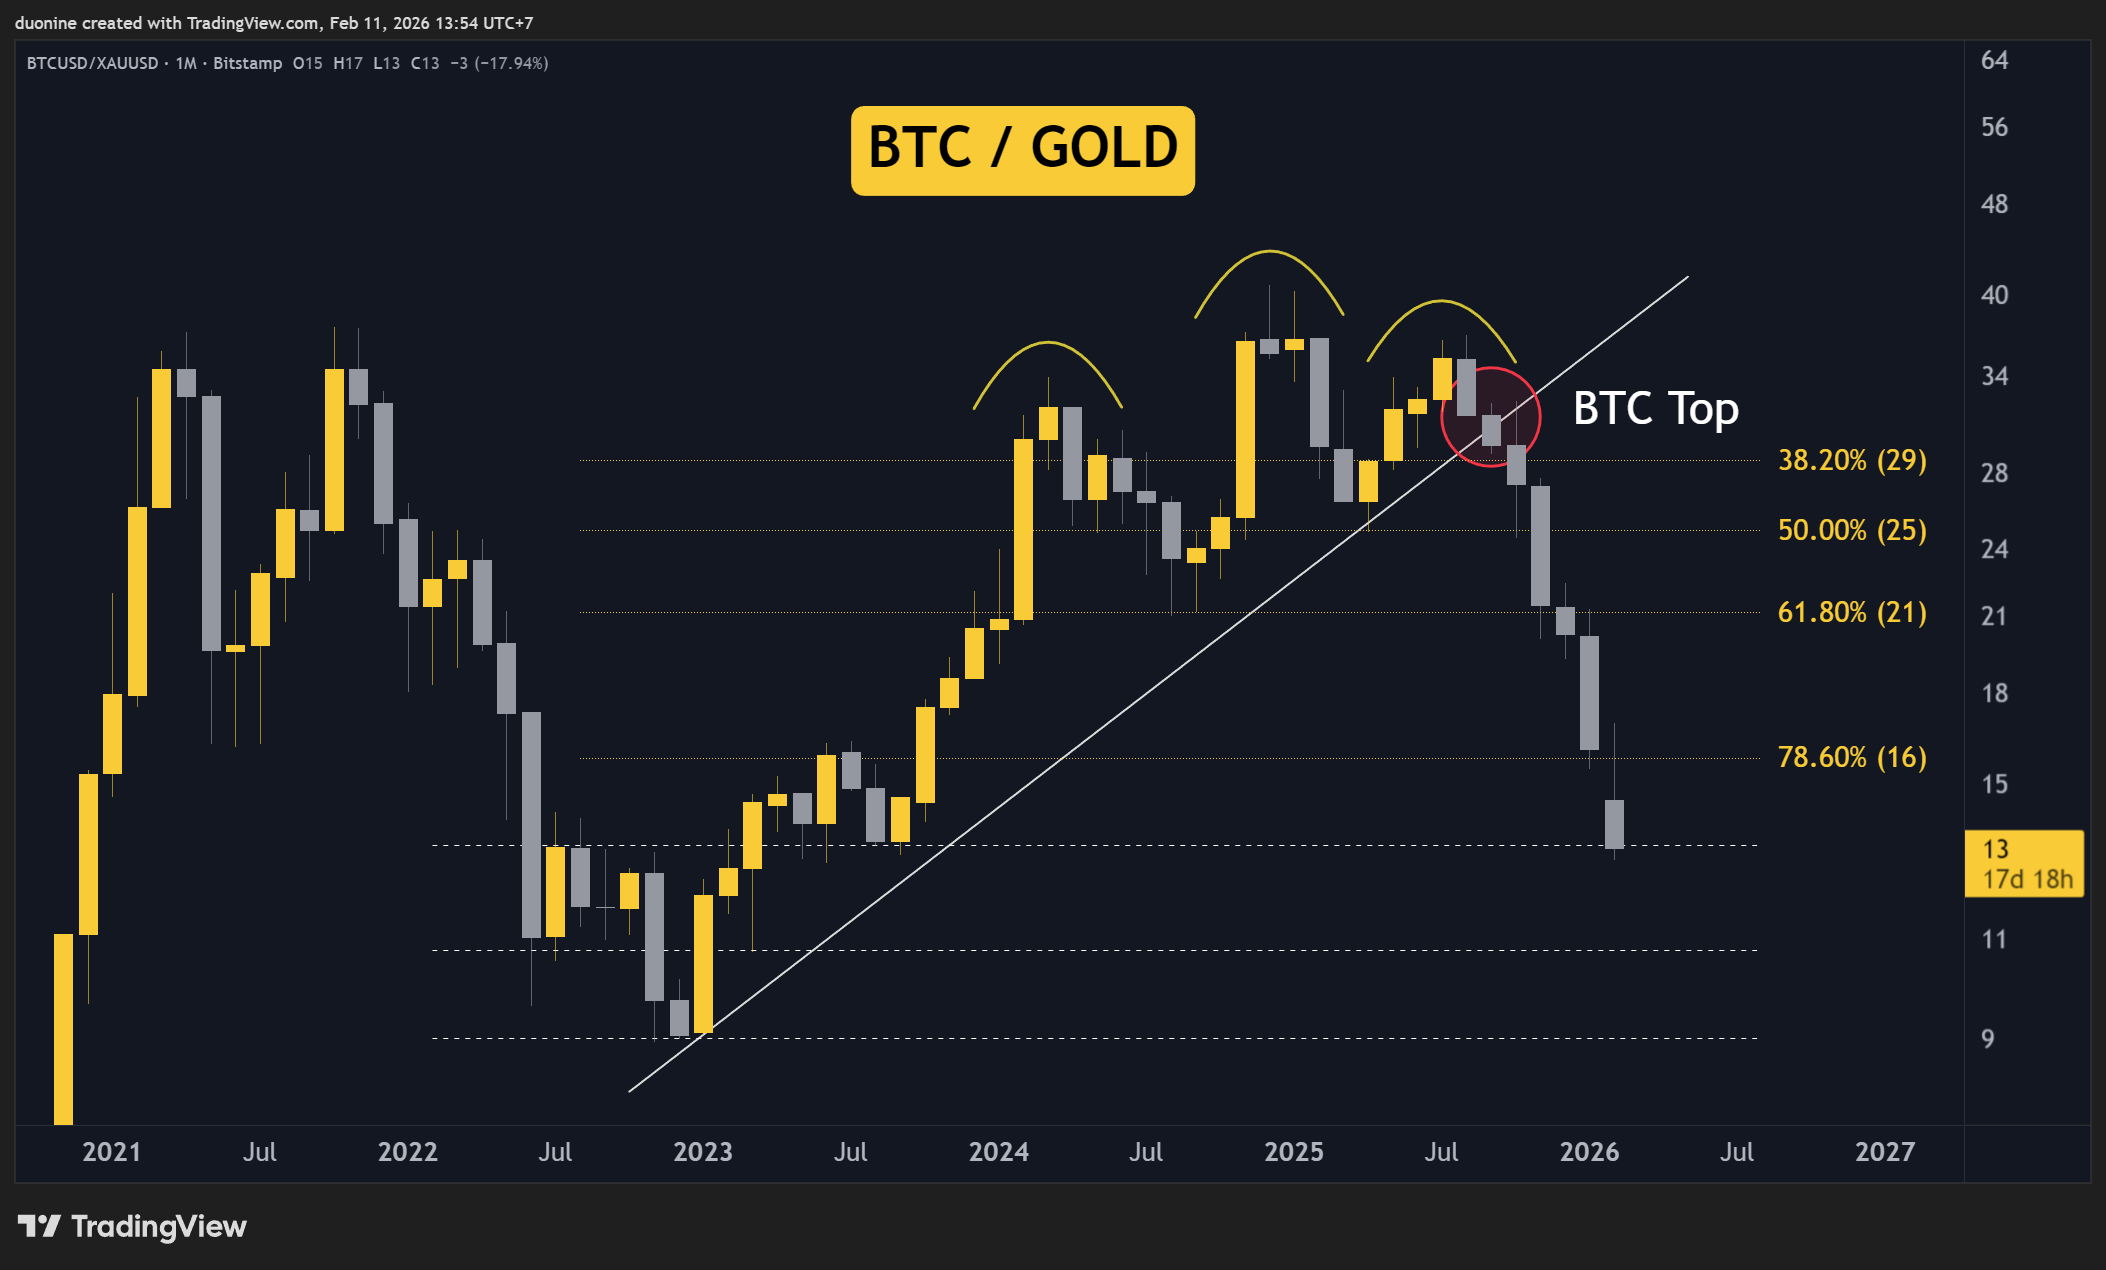
Bitcoin vs Gold
This chart already predicted the Bitcoin top to perfection, can it also predict the bottom? We have a few more levels to touch before the bottom is found, specifically 11 and 9.
I’d be patient until at least July before making any judgement. We need to let the price show us its intentions. What this chart also misses is a bounce. We’ve had no bounce or relief rally since August 2025 vs Gold. That’s seven months of downtrend only! Crazy.
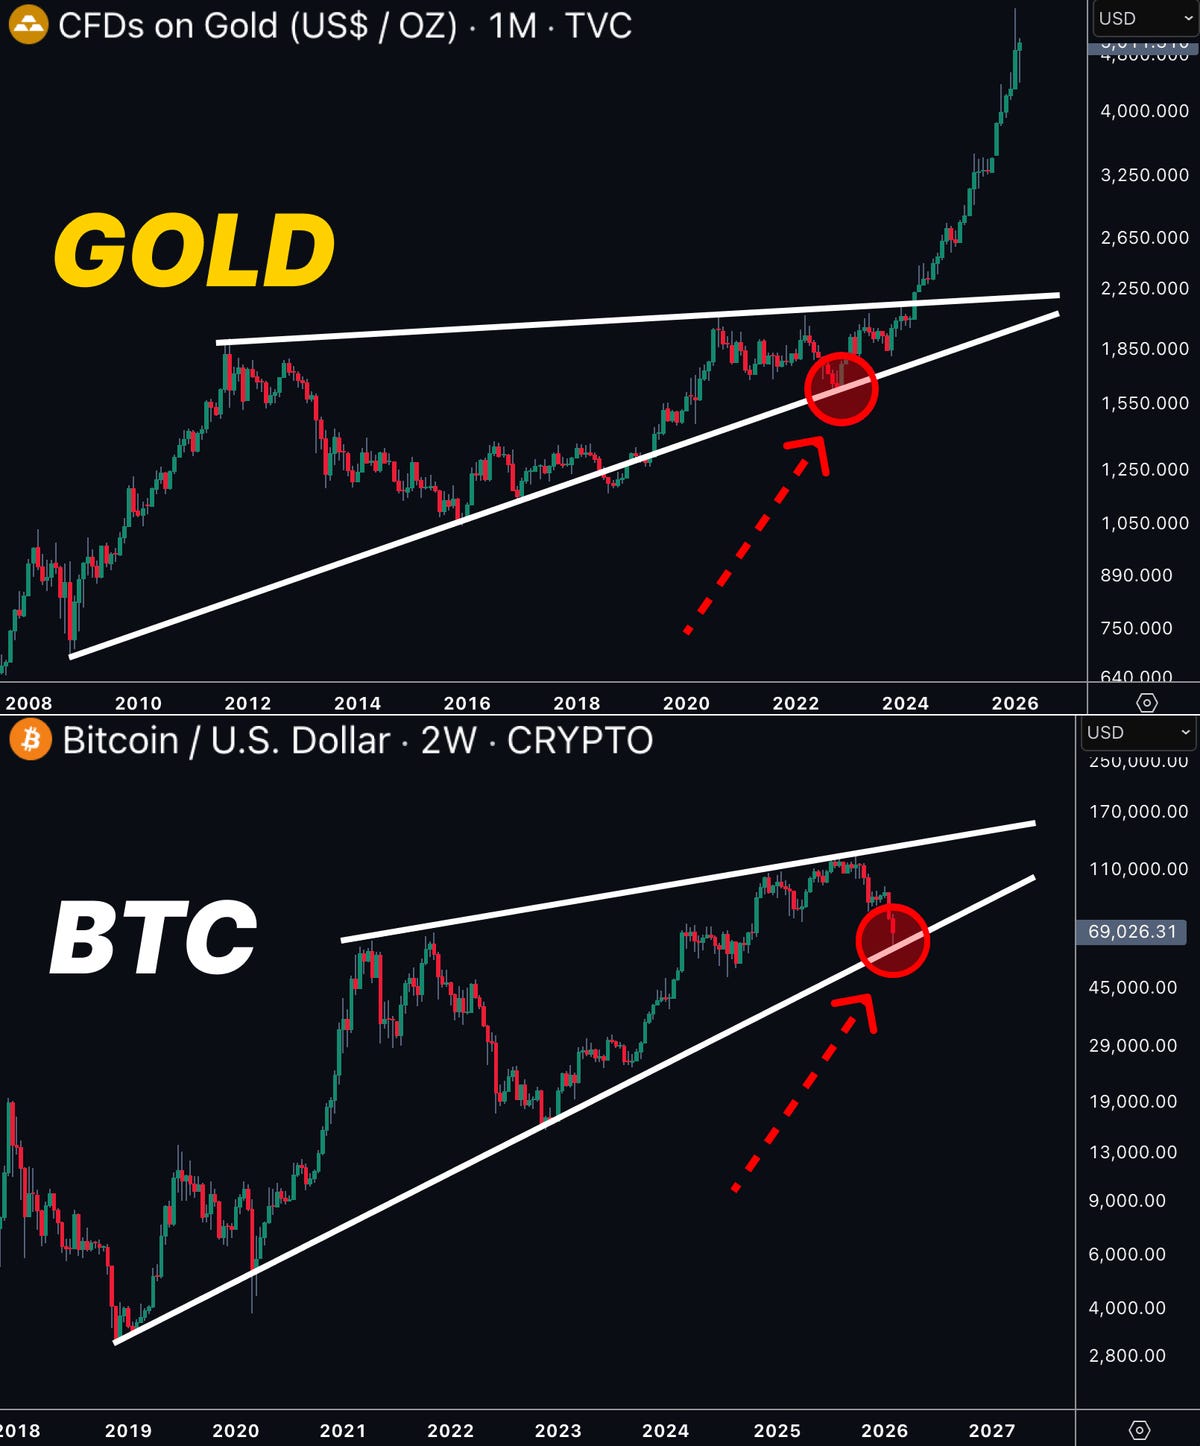
Don’t Fall for Hopium
While the below pattern could hold a surprise for the market, I find such an outcome highly unlikely. The most obvious and likely scenario is for the price to maintain its current downtrend (or existing trend) as shown in previous charts.
For Bitcoin to follow Gold we need a major catalyst or black swan event that can trigger such a significant rally. Don’t bet on this. Keep your cash safe and ready to buy the bottom. Worst case scenario, you lose nothing.
“Crypto/Bitcoin is Dead!”
Until you don’t see these words all over your news feed or on X, you’re probably too early to buy. It’s an excellent bottom signal. While this is not a chart in itself, it’s a sentiment indicator that’s very effective.
The opposite of this is euphoria and ridiculous price targets in a bull market. Such delusion is a great exit signal.
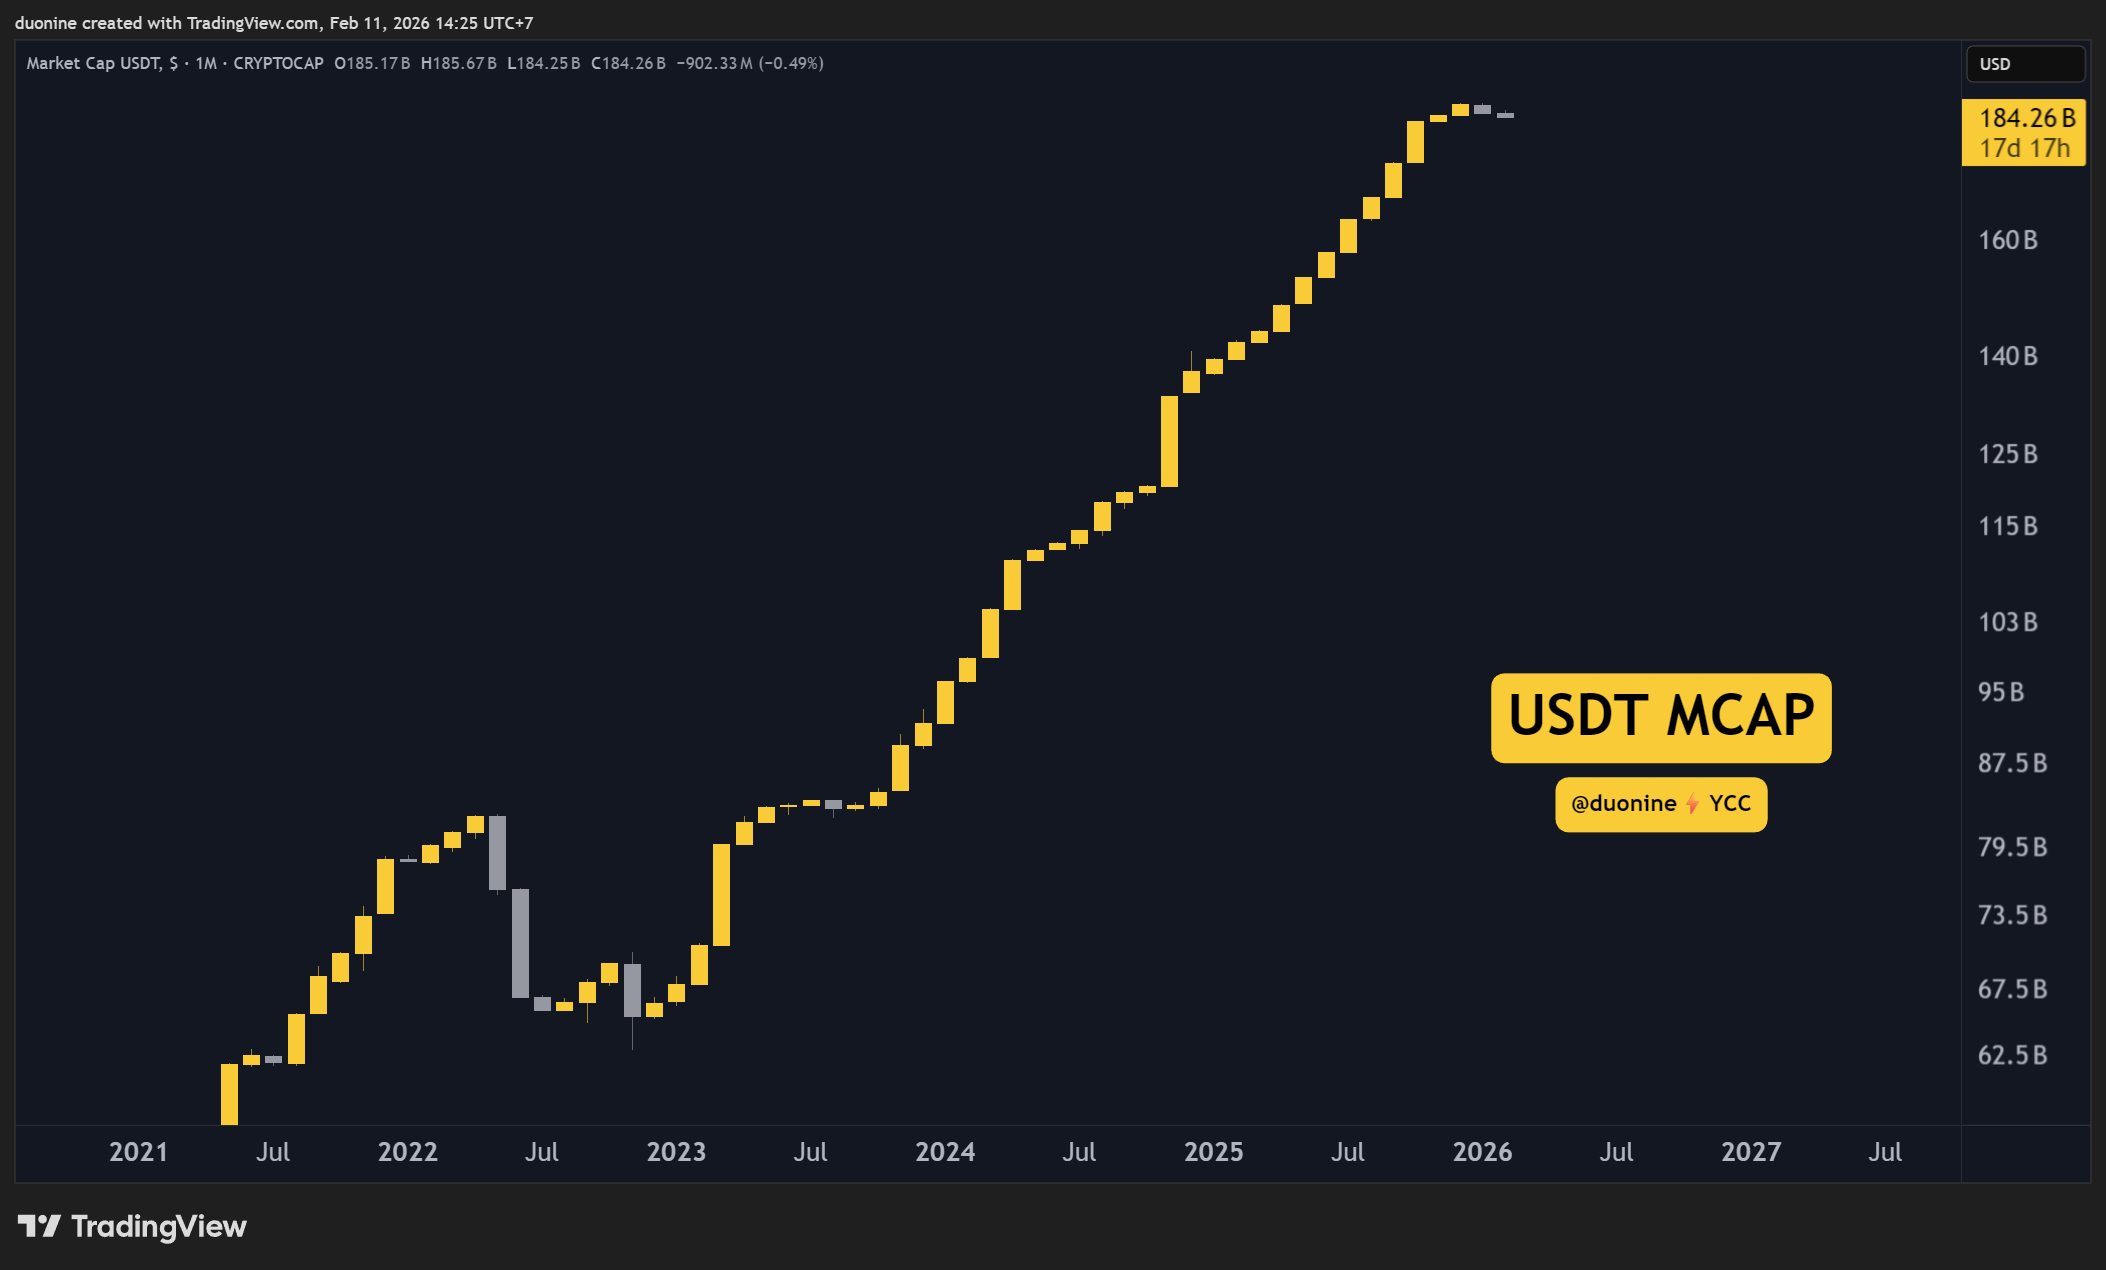
USDT Market Cap
Another excellent bear/bull market signal is the USDT market cap. As long as it makes higher highs, the trend is bullish. This changed since January 2026 when the market cap of USDT started to fall.
As long as this continues to fall, there’s no reason to turn bullish. Start buying once USDT market cap goes up for two consecutive months. That’s a pretty solid buy signal.
Follow the Price Action
Sometimes you just got to follow the price. Buy the red circle. That’s it.
This newsletter is made possible with the generous support of our Patrons and partners. Upgrade your experience by becoming a Patron for lifetime access to our exclusive private alpha! Details are available on our Patrons page. All info is provided for educational purposes only and is not financial advice.
Awesome, actionable chart summary! Bookmarking this, thanks!
Great article.