

We’ve been waiting for a clear bullish signal on Bitcoin for almost a year and we may finally have it.
The weekly RSI shows a clear bullish divergence!
That does not mean we’re out of the woods yet and lower lows are still possible. Nevertheless, this is promising and hints at an end for this bear market. Let’s take a closer look below.
Hundreds of Patrons made YCC their home, your gateway to our exclusive alpha!
Premium access & opportunities + Lifetime Patron role on Discord

I’ve been waiting for this signal on Bitcoin all year and it finally came. The weekly RSI is finally painting a clear bullish divergence.
Take a look at it below.
As you can see, while the price made lower lows, the RSI made higher lows. That’s exactly what you want to see if you’re scouting for a bottom on Bitcoin.
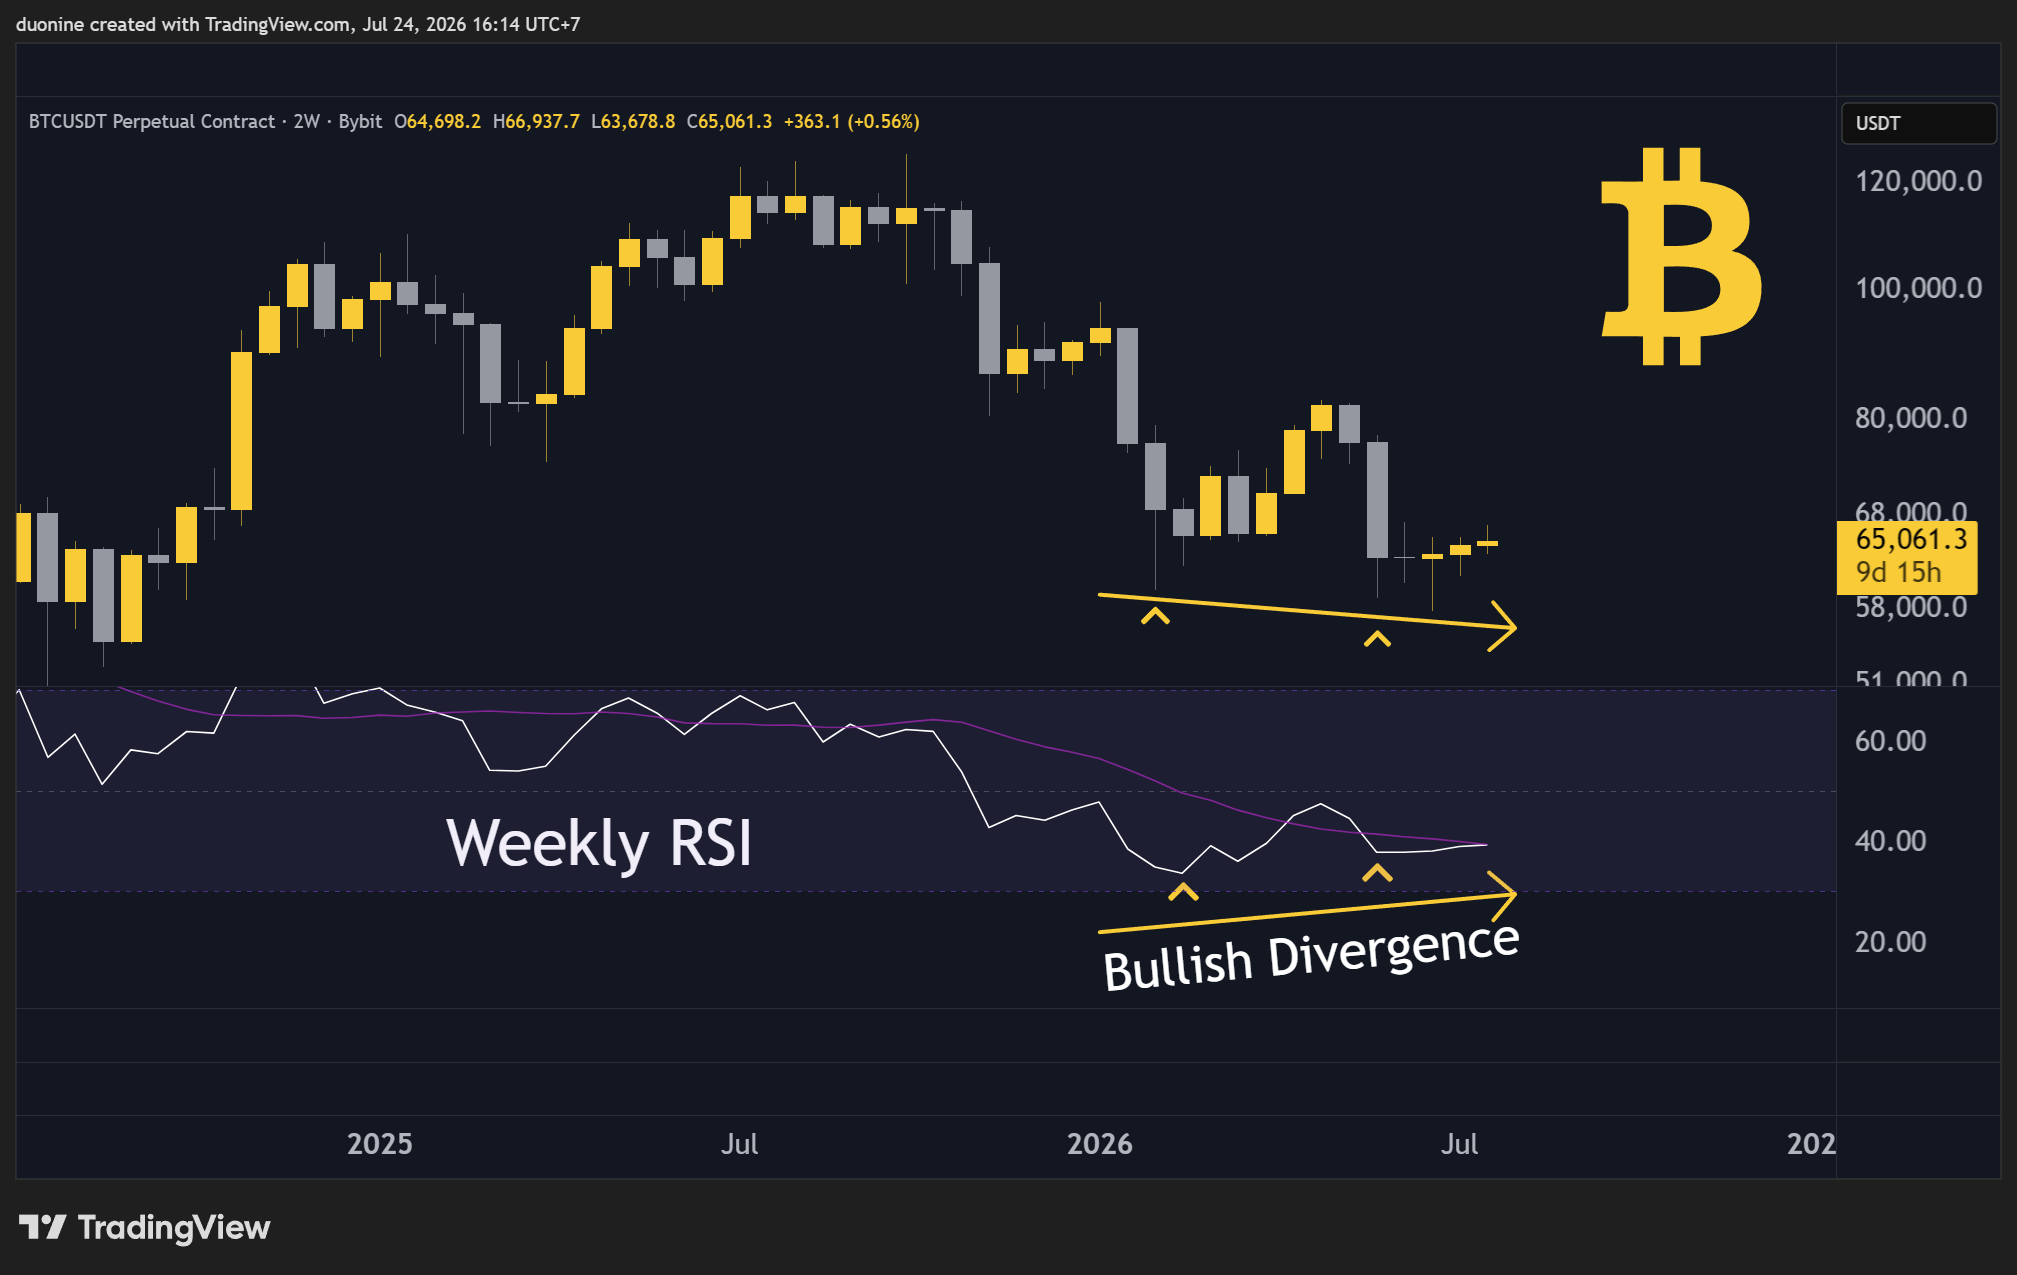
To get confirmation that the bullish divergence is valid, you’d need Bitcoin’s price to make a higher high in the future (above 82k), or at least a higher low (around 60k). That would increase the confidence that the bottom is behind us.
However, I believe it is a bit early to say $58,000 was it.
That’s because a bullish divergence can take months to materialize, and in that time, the price can continue to make lower lows and the RSI to re-confirm the bullish divergence.
As such, I’d not dismiss a new price drop in the future.
If that happens, it’s probably a good time to buy since this pattern will eventually see buyers push BTC into a sustained rally. Most likely towards the end of 2026.
Plus, one indicators showing a bullish bias is not enough either.
You need to find confluences in price action, volume, and momentum.
On the momentum side, the weekly MACD also looks good, with clear higher lows (left chart below). However, on the monthly timeframe (right chart), the MACD remains bearish with a flat histogram that could curve up. It’s just too early to say.
So what’s missing?


First, the price action on Bitcoin is still weak. The price is around 65k at the time of this post, but we really need it to push higher to end the ongoing macro downtrend. That seems unlikely in the near term.
Secondly, the volume profile does not confirm a bottom. Usually, when a bottom or top is made, the volume profile explodes with a huge candle. Take a look at the below daily volume on Coinbase, I don’t see that spike at the 58k price.
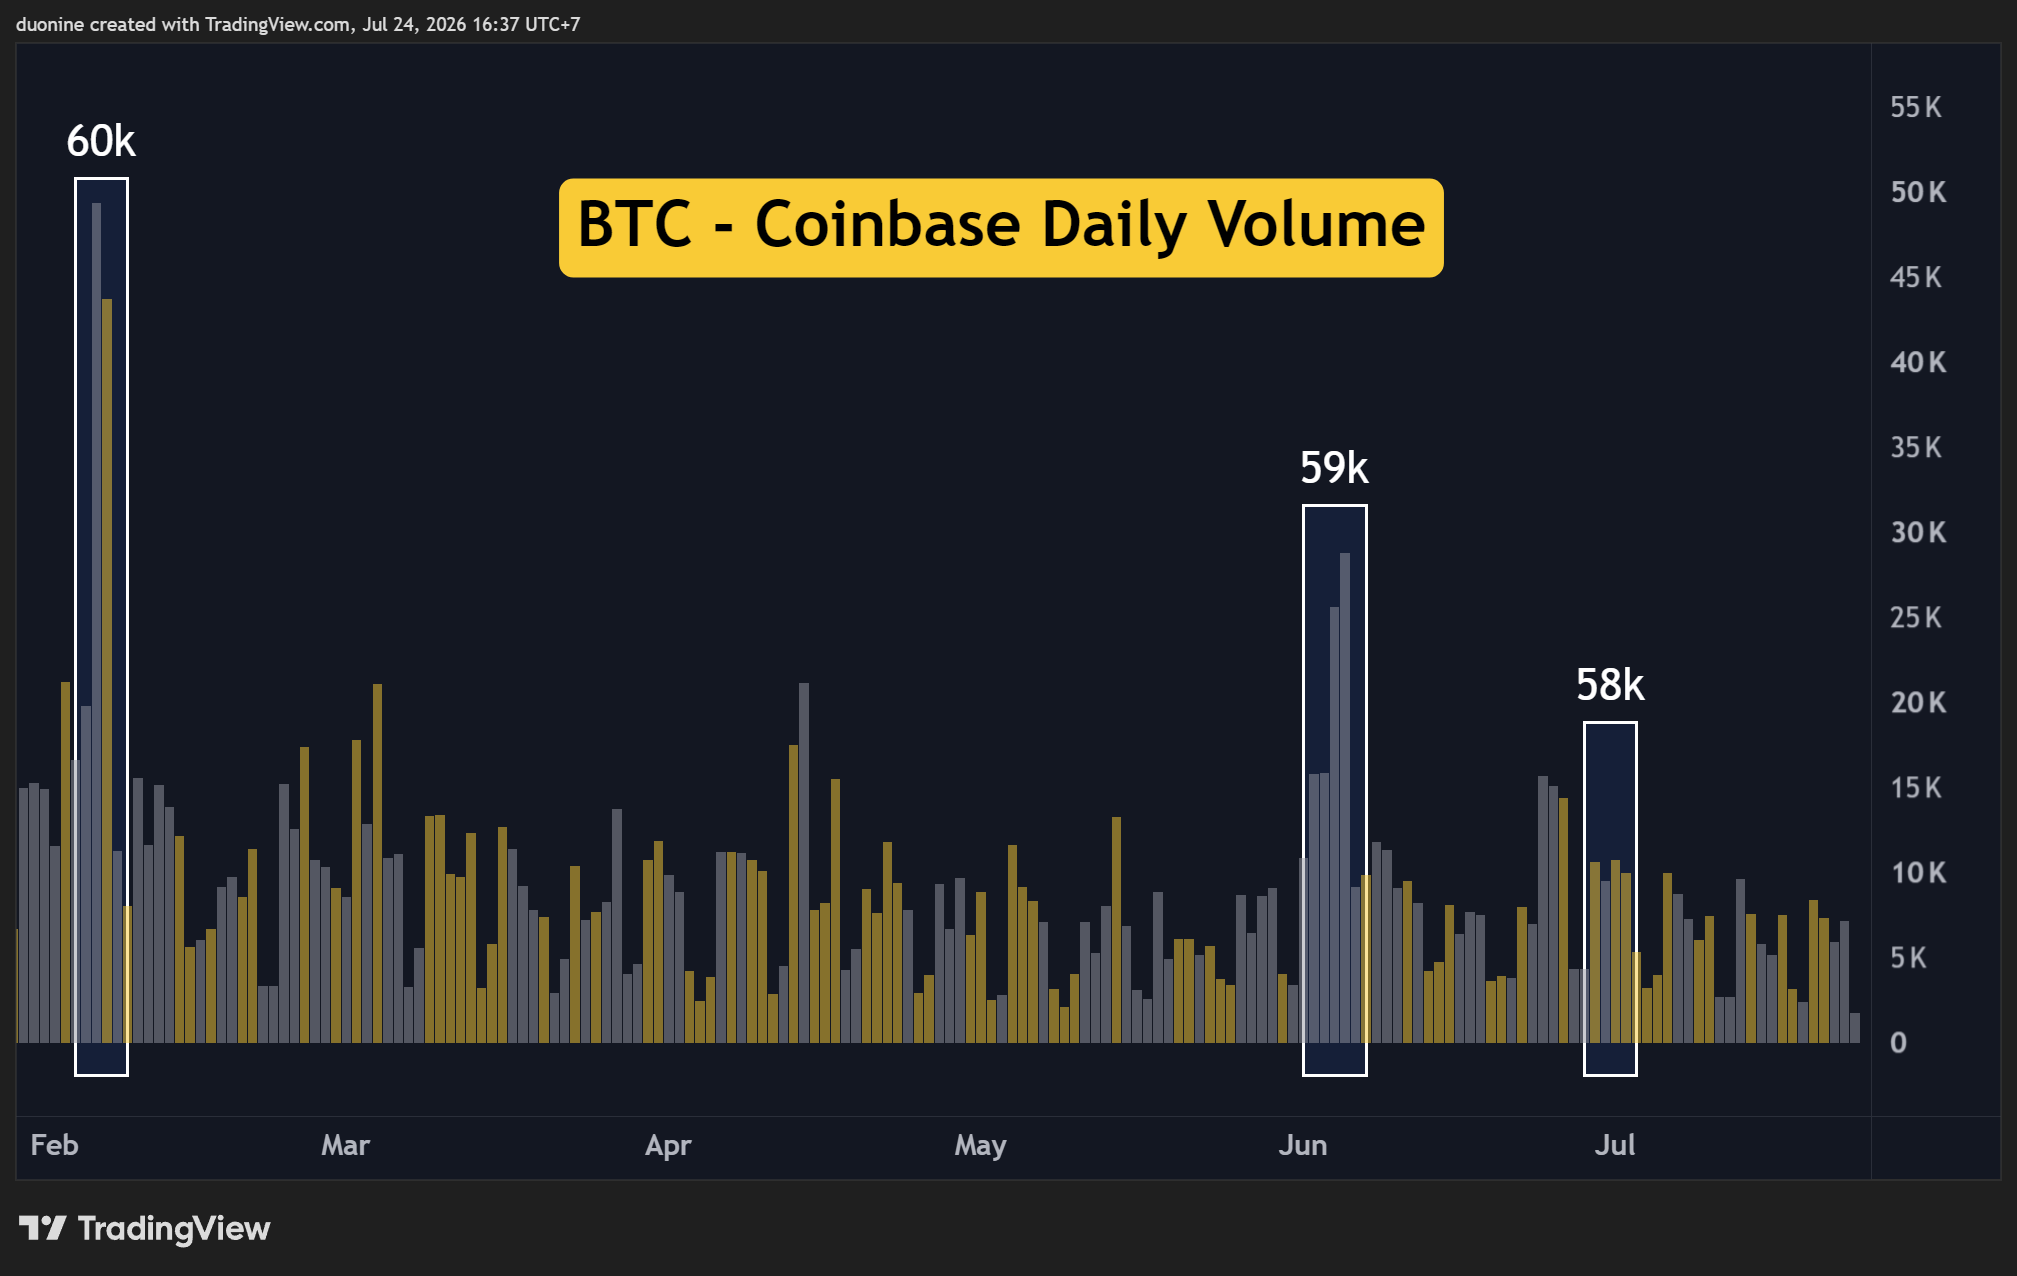
On the contrary, the drop to 58k was on low volume. While buyers came in a sustained way, there was no spike. Historically, volume is a great bottom indicator, but I can’t see it on this chart. That tells me two things:
The bottom is not in and it’s still coming
This cycle is different
I don’t buy the “this cycle is different” narrative since that’s exactly what everyone said about the 4-year cycle. Yet, Bitcoin crashed exactly on time.
With that said, there is a good chance Bitcoin will make a lower low, perhaps just under 50k. That’s when volume could explode to give us a clear bottom and another bullish divergence point on the weekly RSI.
In that moment, I’m a buyer and won’t wait for more bullish signals since that would make me quite greedy. As mentioned before, even if we don’t get a lower low later this year, I will start buying after October no matter the price.
Missing out on Bitcoin because you waited for a specific price will hurt when it rallies again beyond 100k. That may very well happen in 2027. Best to DCA before the year ends and if we get another drop, buy it.
Good luck and subscribe below for more market alpha!
This newsletter is made possible with the generous support of our Patrons and partners. Upgrade your experience by becoming a Patron for lifetime access to our exclusive alpha! All info is provided for educational purposes only and is not financial advice.
DCA has never failed. Combine that with bigger buys on large dips and you can't go wrong as long as the asset you buy is a long term appreciating one, like BTC.