Three trading indicators to master the market
This is your step-by-step guide with my most successful trading indicators.
Indicators are derivatives of price and volume. Therefore, always priorities the source data before diving into indicators built on top. Derivatives are like wBTC on Ethereum and are no match for native BTC.
Aim to understand the basics before you move into more complex indicators that just confuse you. To simplify, I suggest you focus on momentum indicators.
I use three such indicators and they help me have an accurate bias about the market - bullish, flat or bearish. Once you have established your bias, you can focus on your trading strategies. Time to dive in. TLDR at the end.

To test different indicators, you’ll first need a TradingView account. If you don’t have one, use my referral - it’s free to have an account (also follow me and use my crypto watchlist - it’s public and you can import it to your account).
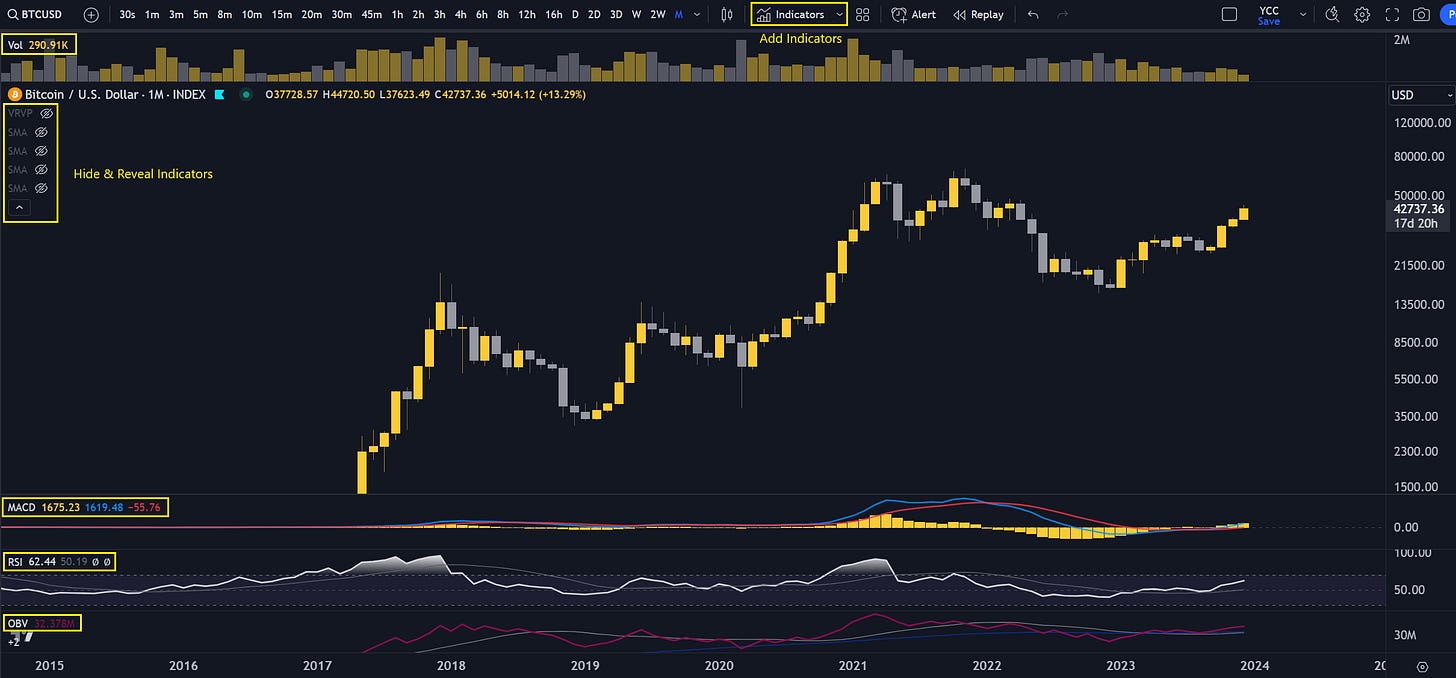
Once you are set-up, open your chart and start adding indicators using the menu at the top as illustrated in the below weekly chart. It shows Bitcoin as I see it in my account. A breakdown of my indicators next.
I use three momentum indicators which are shown at the bottom of the above chart. Two are based on price action (MACD + RSI) and one on volume (OBV).
This is important when looking for confluences - points on the chart where different indicators and key price levels meet. Confluences increase your confidence in a particular price action and provide you with a confirmation for the bias you hold. I use the default values, but I tweak the visuals to fit my style.
Lets take a closer look at them, but remember that price and volume are your bread and butter. Anything else is a derivative of that. More on that later.
MACD - Moving Average Convergence Divergence
Use it to assess your bias, find tops and bottoms, and bullish / bearish divergences that can hint at a reversal
Are the MACD moving averages moving up, down or flat? Is the histogram (the yellow bars) on the positive or negative side? Are they making higher highs or lower highs? This is an excellent way to assess your market bias.
The answers will quickly allow you to know where you are in the market. Right now, we’re in a bullish market. We’ve been in one since January 2023 when the monthly MACD histogram (pictured) started making higher lows with conviction and increased momentum.
This bias was quickly confirmed when BTC’s price made a higher high and then the MACD moving averages did a bullish cross over the summer months.
This indicator works great on any timeframe, but as you zoom into lower timeframes, confidence decreases. Also notice the bearish divergence (i.e. higher BTC price, lower MACD histogram) from 2021 which was an early top signal in the last cycle.
RSI - Relative Strength Index
Use it to spot bullish / bearish divergences and possible reversals of the price action. It’s a poor indicator for tops or bottoms, use MACD for that
The RSI tells you how much conviction the market has into a particular price action. If the RSI is making higher highs that indicates strong buy volume which will typically correspond to increasing prices like the top from early 2021.
However, if the RSI shows a bearish divergence, then that signals weakness in the price action. This highlights a possible reversal which soon came in late 2021 as illustrated above. While BTC’s price made a new all-time high, the RSI barely moved above 70 points, much lower than in the past. This was a clear bearish signal.
Pay close attention whenever the RSI is above 70 points or under 30 points. Altcoins that have strong volatility should use an RSI with 80/20 as upper/lower bands. That will give you more precision when you need to pay attention.
If the RSI is at these extremes, then the price is considered overbought or oversold, but don’t be misled by those labels! The RSI can stay for months into an “extreme” level and that actually shows strength if above 70! See BTC’s 2017-2018 monthly RSI which was extremely high and the price kept going up. Instead, also look at MACD and volume to have a better sense of a possible top or bottom.
OBV - On-Balance Volume
Use it to assess your bias, market direction and strength of price action
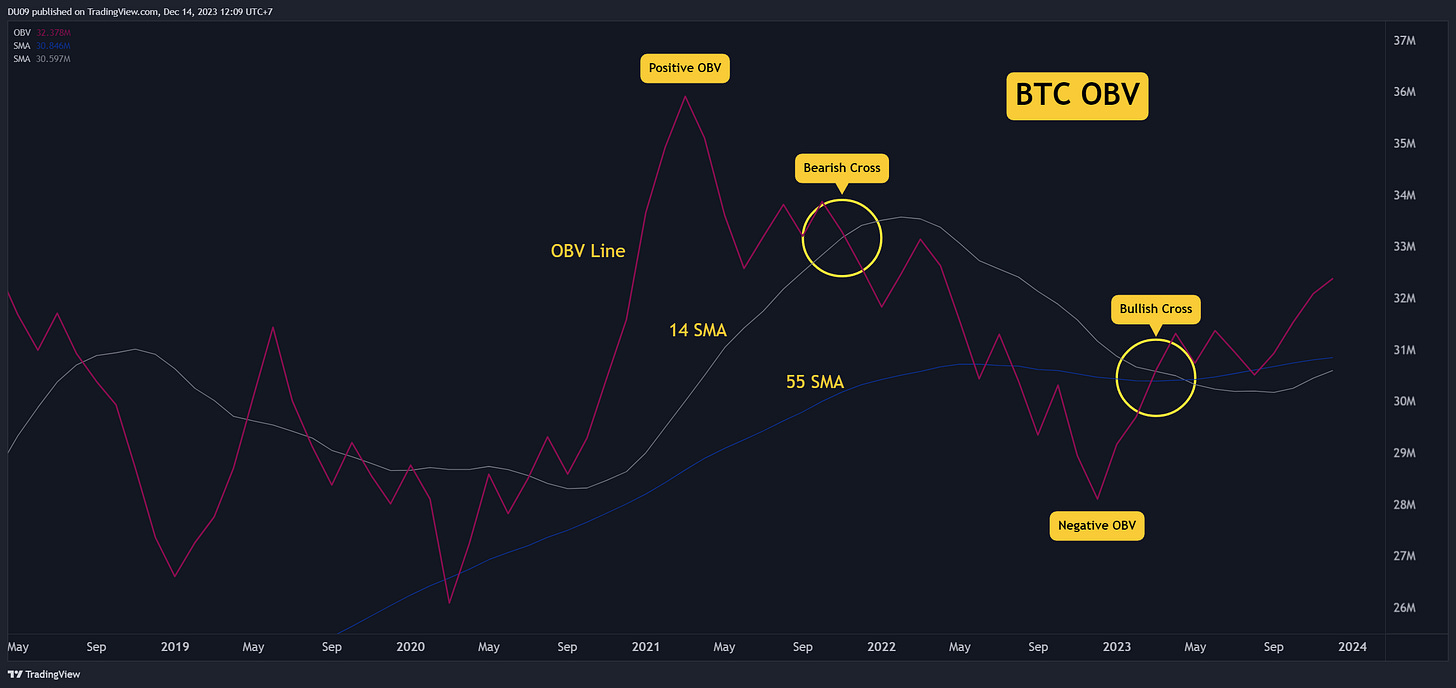
The OBV is a fancy way to assess volume and measures positive and negative volume flow. More buy volume than sell volume? Net is positive, indicator goes up. More sell volume than buy volume? Net is negative, indicator goes down. Easy right?
I also added two Simple Moving Averages (SMA) on this indicator, one with 13 as length and one with 55. You do that by going to your OBV settings, then add indicators on top as shown below. Double-click the SMA line and edit length to 13/55. The two SMA are also Fibonacci numbers (see here why).
The point of using the two SMA is that they can show bullish / bearish crosses which are important signals to assess your bias in conjunction with the MACD and RSI. This is not so obvious when looking only at the standard volume indicator which I cover below.
Volume
Use it to confirm your bias, the strength of the price action or to find tops and bottoms
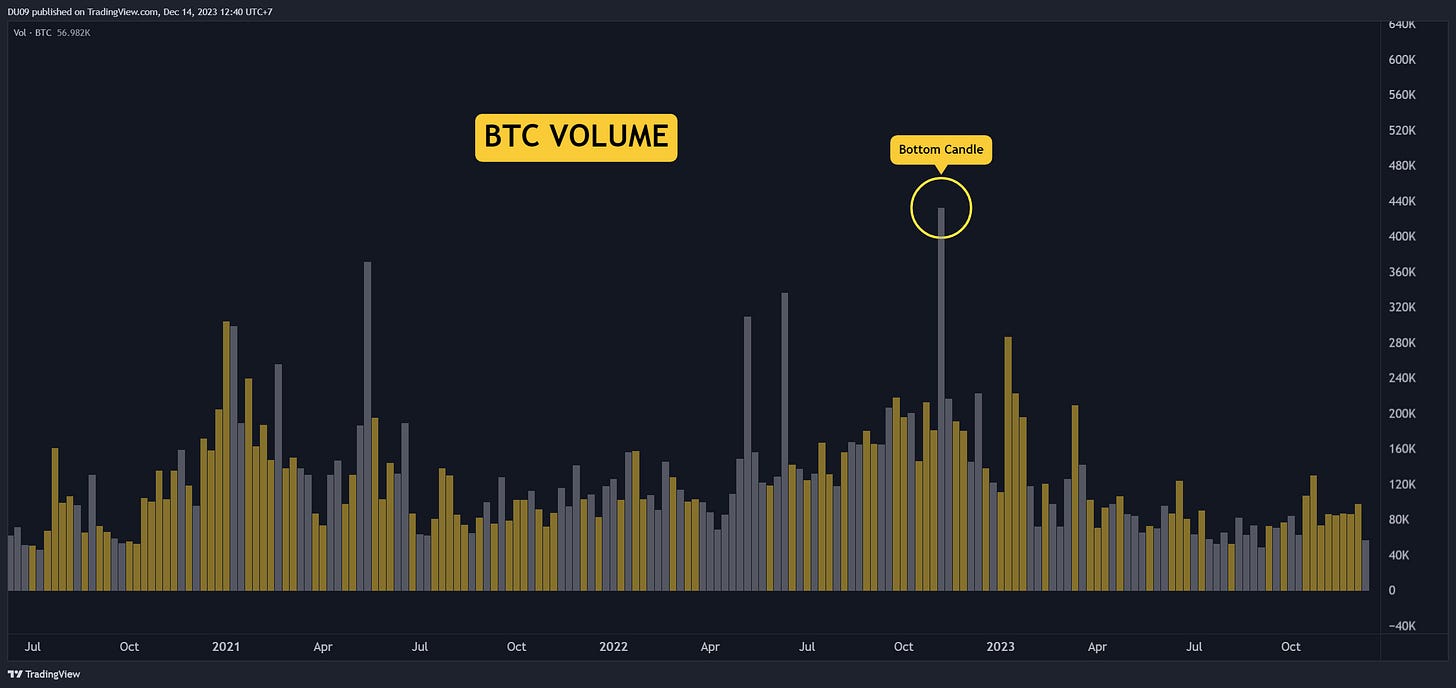
This is a must on any chart and I keep it at the top on a separate pane since I like my price chart clean. Volume profile is key to understanding the conviction behind the price action when studying particular candles, especially during a pump, crash, breakout or breakdown.
Notice how the highest sell volume candle on the weekly Bitcoin chart was in November 2022 when Bitcoin bottomed at 15k. This is Coinbase data and you buy when this happens. Other examples include:
Highest buy volume on record? Probably a top, start selling.
Highest sell volume on record? Probably a bottom, start buying.
Increasing volume on breakout? Bullish.
Decreasing volume on breakout? Be careful, can be a trap.
Decreasing volume as the price bottoms? Bullish reversal soon.
Price action
This is where the action is. Nothing else comes first
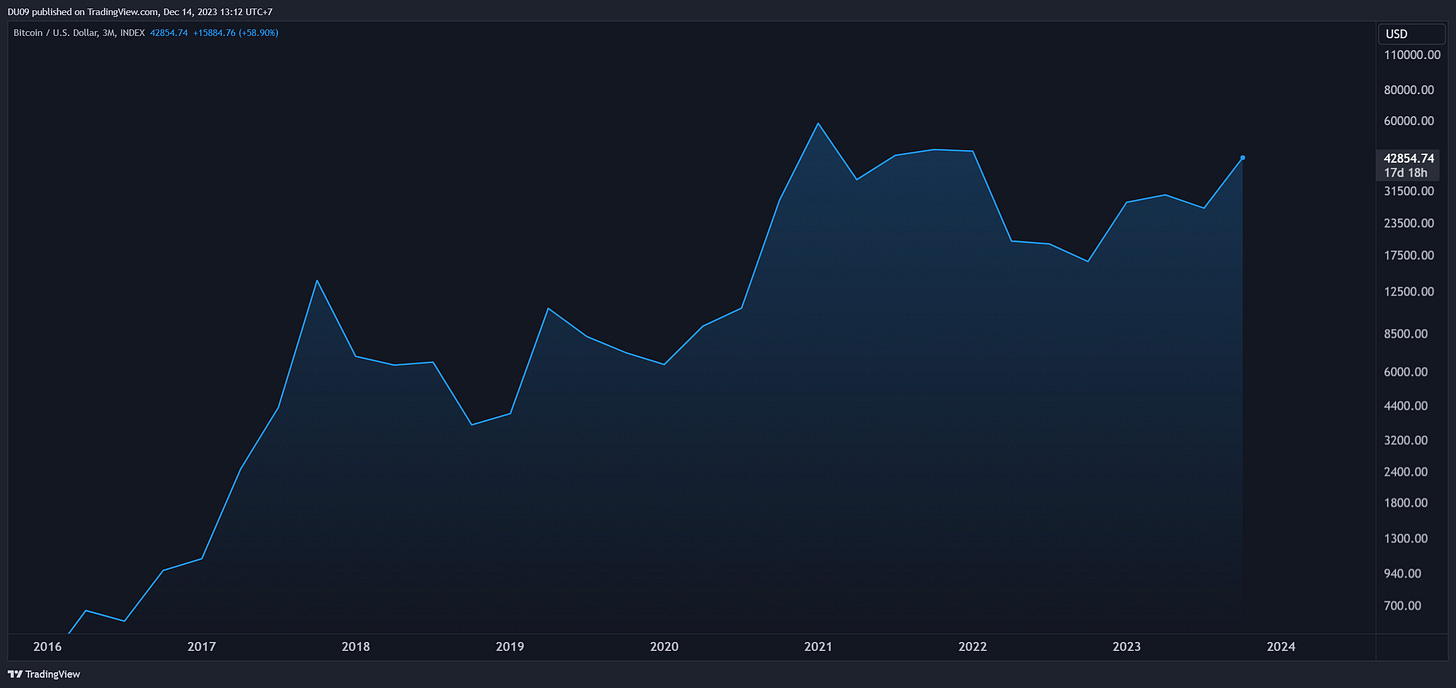
There are many ways to express a price on a chart. Using candlesticks is only one of many options. An easy way to illustrate that is by looking at the below chart. It’s the Bitcoin price expressed as a simple line and a quick glance will tell you the correct bias.
Higher lows and higher highs = bullish. Easy.
You don’t need any fancy indicators to tell you that. If you study price action long enough, your indicators will become secondary and only be useful to confirm your bias.
Generally, the more indicators you use, the more confused you will be. Nevertheless, they can be extremely useful to correctly assess your bias and spot key moments in the market across different timeframes.
Moving Averages - Simple (SMA) & Exponential (EMA)
Use them to assess your bias and find key support & resistance levels
The exponential MA gives more weight to the most recent price action while the simple MA treats all candles equally. I recommend to have at least a few moving averages on your chart to double check for confluences and key levels (25 SMA, 50 SMA or 200 SMA are popular). The exponential MA may be more precise at times, but can also misled during volatility.
I keep mine hidden by default and only make them visible when I want to check levels. Price above the 200 MA? Bullish. Below it? Bearish. Moving averages can also act as support or resistance as shown above. The higher the timeframe and MA used, the more confidence.
Fibonacci numbers
Use them to find key support and resistance levels on the price chart
Use Fibonacci retracements or extensions to find key levels on the price chart. I made a full guide on that and it’s important you study that as well. Bots and experienced traders use them all the time. It’s also why they work so well.
Indicators cannot be isolated from the price chart and where demand and supply meet. These are pivotal points on all charts.
Know your indicators
I focus on the above momentum indicators because they cover both price action and volume. However, they are also lagging indicators (they show you the past) and the market can always surprise you, especially on lower timeframes. This is why its important to know the limits of your indicators.
A good understanding of price action and volume can give you an edge as you can react instantly to what is happening. That takes time and practice. Don’t forget this as you seek the next indicator (or paid indicator) that has “all the answers”. They usually don’t and can also mislead you if you put all your trust in one.
TLDR & Tips to Remember
Indicators are derivatives of price and volume, which are primal
Understand your indicators and what they tell you before using them
Don’t change indicators every day, give yourself time to get comfortable
Use indicators to confirm your bias and seek confluences at key levels
If you don’t understand an indicator, don’t use it and don’t trust it blindly
Moving averages and Fibonacci numbers can increase your confidence level
Everyone is different, find what fits your trading style best
Less is more
This newsletter is made possible with the generous support of our community Patrons and partners. Upgrade your experience to show your support by clicking the below button or reach out. 


