
Ethereum Breakout - How to Find the Top in 3 Easy Steps!
Price discovery is about to start as soon as Ethereum cracks $5,000. The race for the next major top is here!

The last time Ethereum was this high, it was 2021. Back then, it topped at $4,868. At the time of writing this, ETH is at $4,720 and we’re just getting started.
Ethereum is about to race to its next major top!
In this post, I’ll show you three key steps on how to find the top in this Ethereum rally before the masses react. Scroll down to begin.
By reading this newsletter you’ve Unlocked 10 FREE Entries to EARNMax’s $20K Monthly Prize Pool.

The Basics First
To understand where we are going it is important to understand where we are now. As you can see on the chart below, this is the first time since 2021 when Ethereum is challenging the all-time high (ATH) at $4,868. This is BIG!
The price already broke above $4,000 in early August. In 2024, this level acted as resistance three times. The road is now clear for a major test of the ATH.
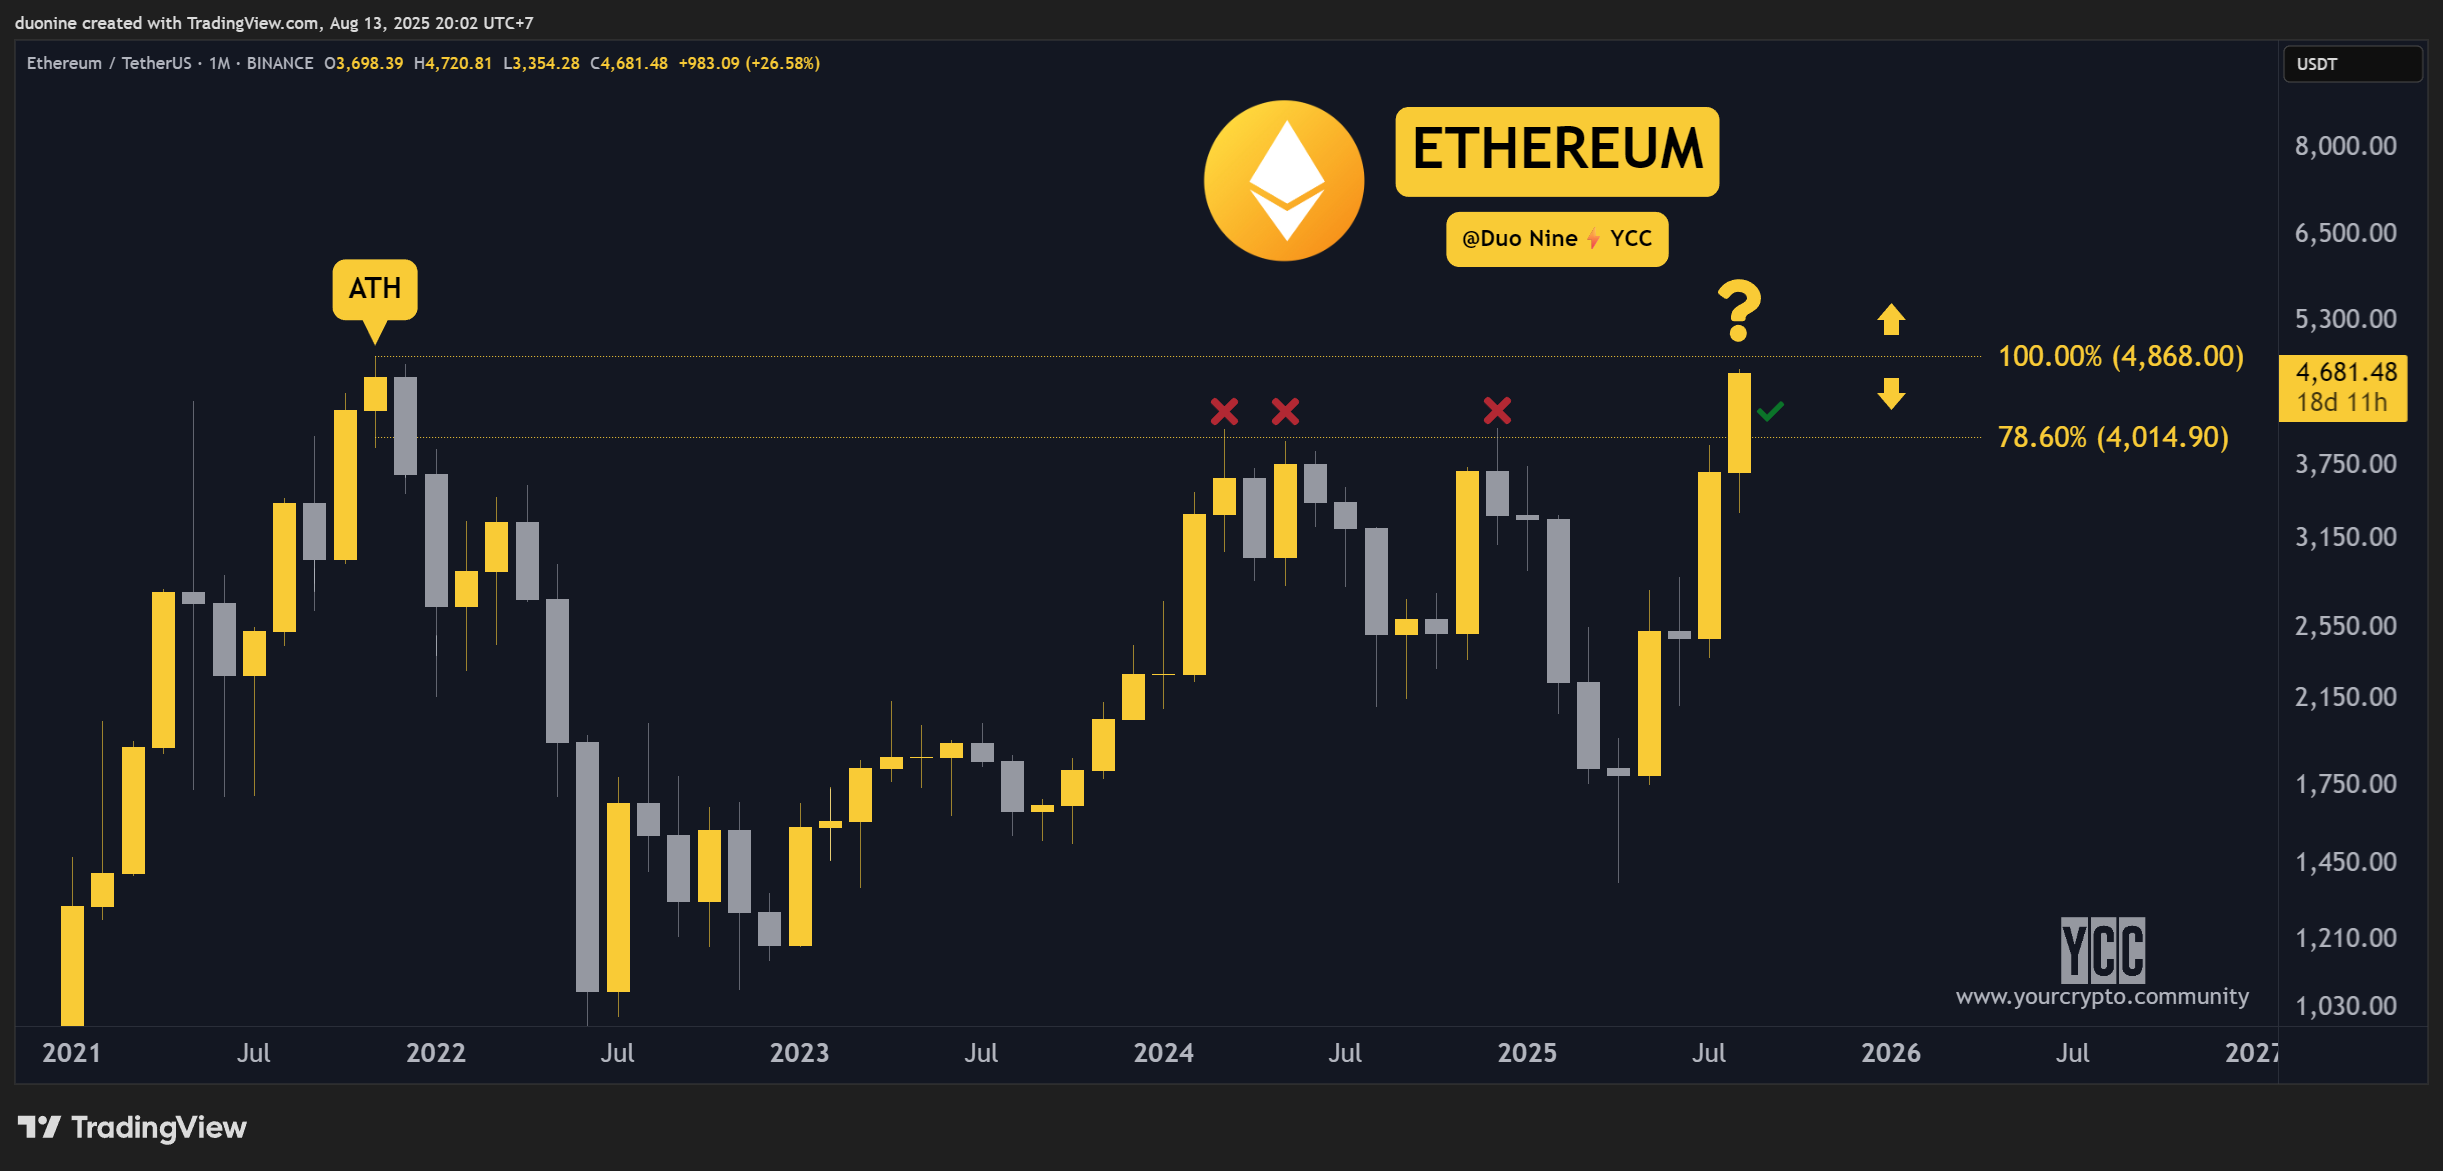
Considering it’s been four years since the price was this high, it is extremely likely for ETH to break its 2021 ATH. This will take Ethereum into price discovery.
Price discovery is a very exciting period because nobody knows what is the fair value of one ETH token. This means its price can swing by a wide margin until it finds equilibrium again and eventually a new top.
Bookmark this guide so you revisit it in the weeks and months to follow! It will be very useful to scout Ethereum’s next top!
The ETH/BTC Pair
Since on the ETH/USD chart Ethereum is about to enter unknown territory, we need a map to guide us beyond a price of $5,000. Luckily, we have the ETH/BTC pair which allows for that.
While Ethereum went to $1,400 this year, Bitcoin moved above $100,000. This led to ETH falling significantly against BTC. This ratio between ETH and BTC is what allows us to estimate a top for Ethereum in the future.
As you can see below, Ethereum bottomed against Bitcoin around April 2025. Since then, it’s been a non-stop pump to recover most of the losses from earlier this year. We can also call this a classic V reversal.
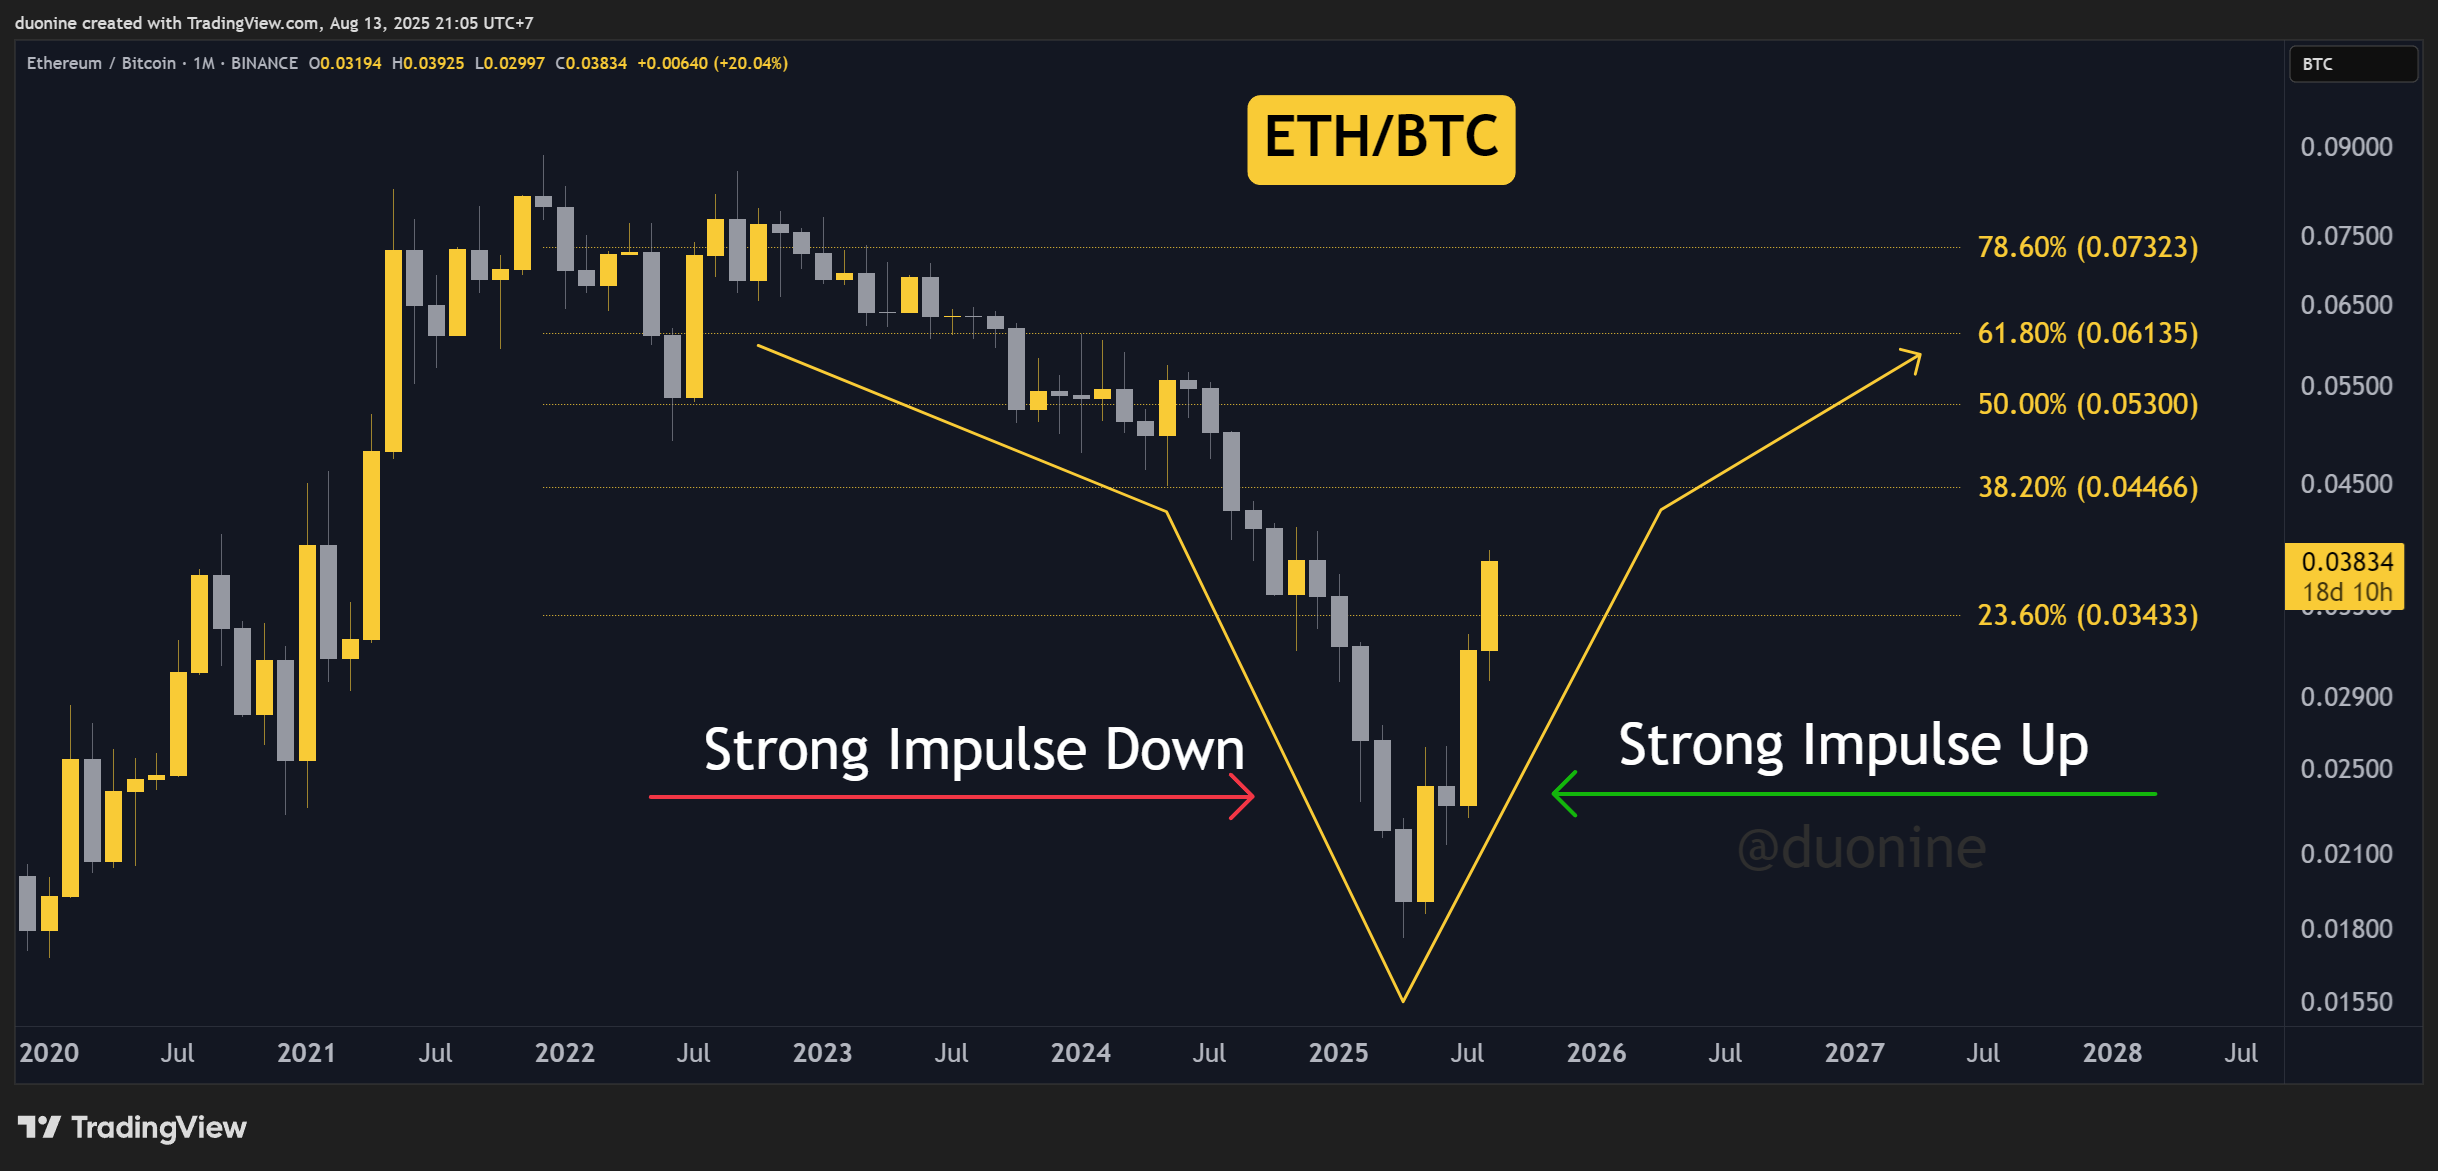
This reversal will likely see Ethereum quickly run to around 0.06 BTC before slowing down. That’s about $7,000 for one Ethereum based on today’s Bitcoin price of $120,000.
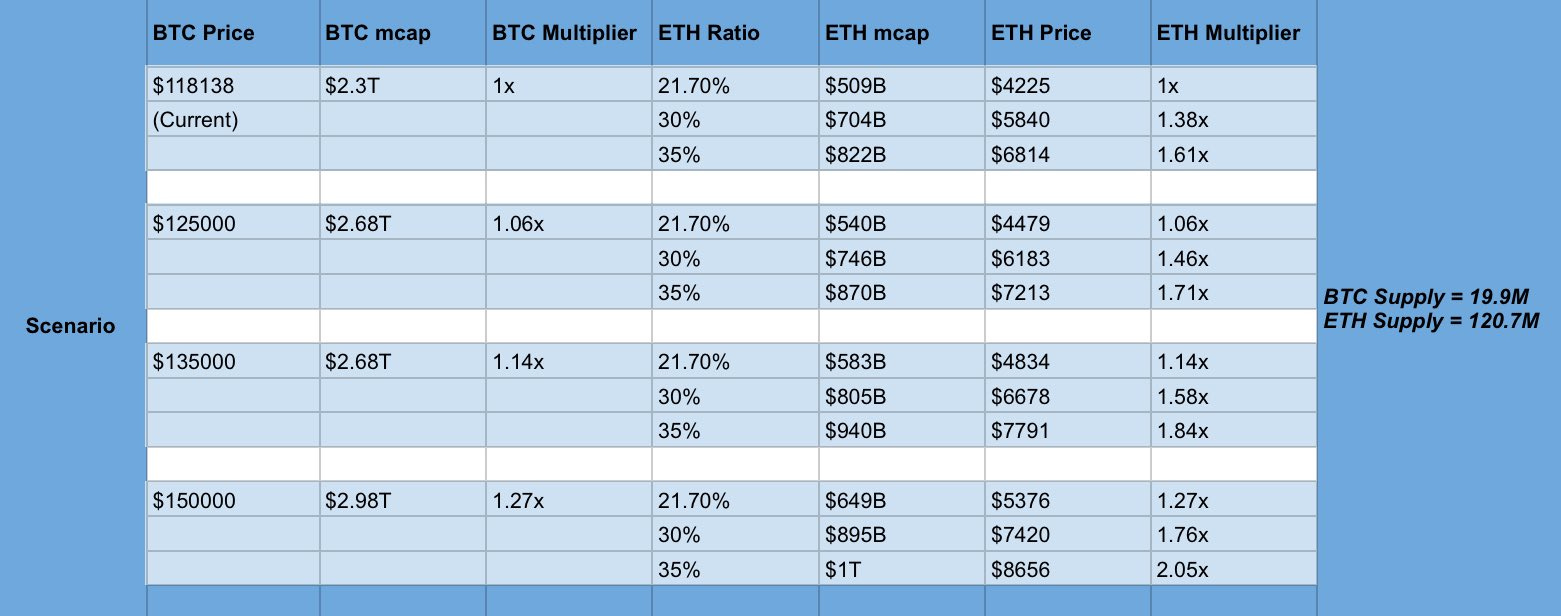
However, Bitcoin may well go higher in the coming months. For example, if BTC hits a price of $150,000, then Ethereum could realistically approach $9,000 based on the above chart. Below a table with some similar scenarios.
If Ethereum manages to go beyond 0.06 BTC, then a price of $10,000 or more should not surprise you, especially if Bitcoin continues up from here. Either way, a top in BTC terms could happen anywhere between 0.06 and 0.10 BTC per one ETH.
I’d be very careful if Ethereum approaches a price of 0.09 BTC since that was the top in late 2021. Probably best to secure solid profits there. Either way, a price above $10,000 should attract sellers. Keep that in mind.
To find more confidence in your decision to sell, check the next two sections.
Ethereum ETFs Net Inflow
You can forget the price for a second and study the inflow of money into the Ethereum ETFs. As long as the flow is positive and is making higher highs, this is bullish.
As you can see below, investors are dropping billions in Ethereum ETFs right now. This explains the recent rally and why it is so aggressive. As long as this continues, we’re in good company. Link to the live chart here.
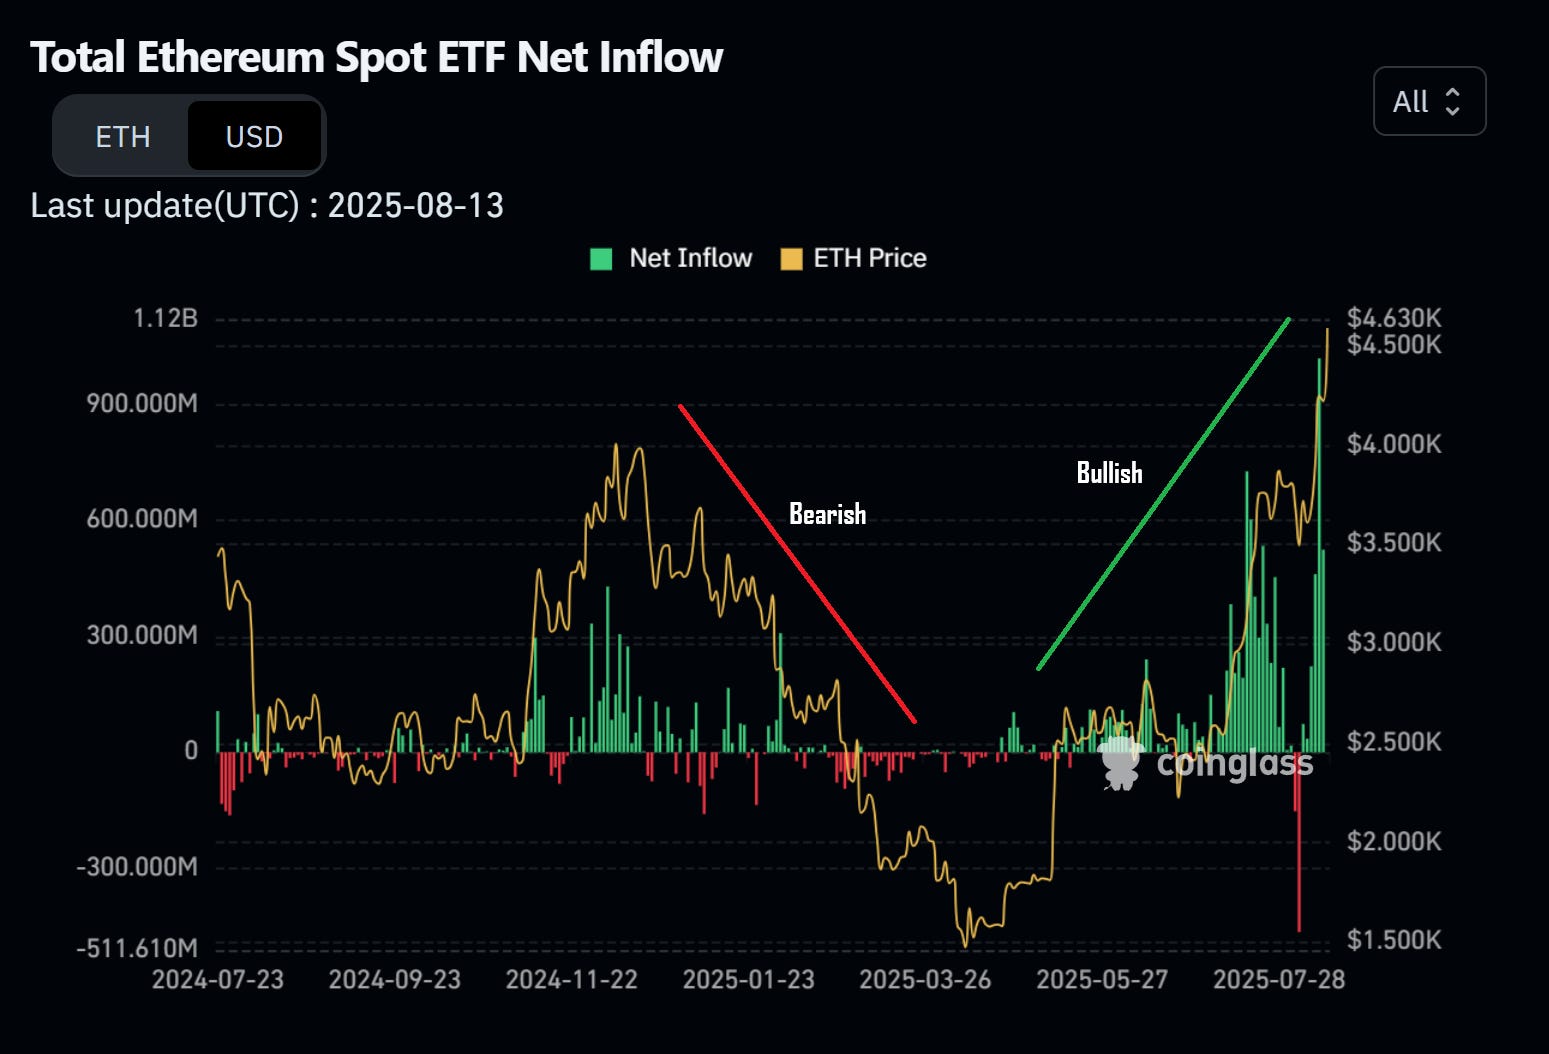
However, once you spot lower highs in net inflows and net outflows start increasing over time (the red bars), it’s probably good to be weary since it would signal profit taking.
If you spot such a shift in inflows when Ethereum is around $10,000 the signal is clear. Start taking good profits. If that moment coincides with other key signals like ETH being priced around 0.09 BTC, don’t hesitate.
Major Trendline Breaks
This is a classic signal to bail.
Essentially, you zoom out on the weekly or monthly chart and draw a trendline (must touch two points at least). As soon as the price falls and closes below the trendline on the weekly or monthly chart, you bail.
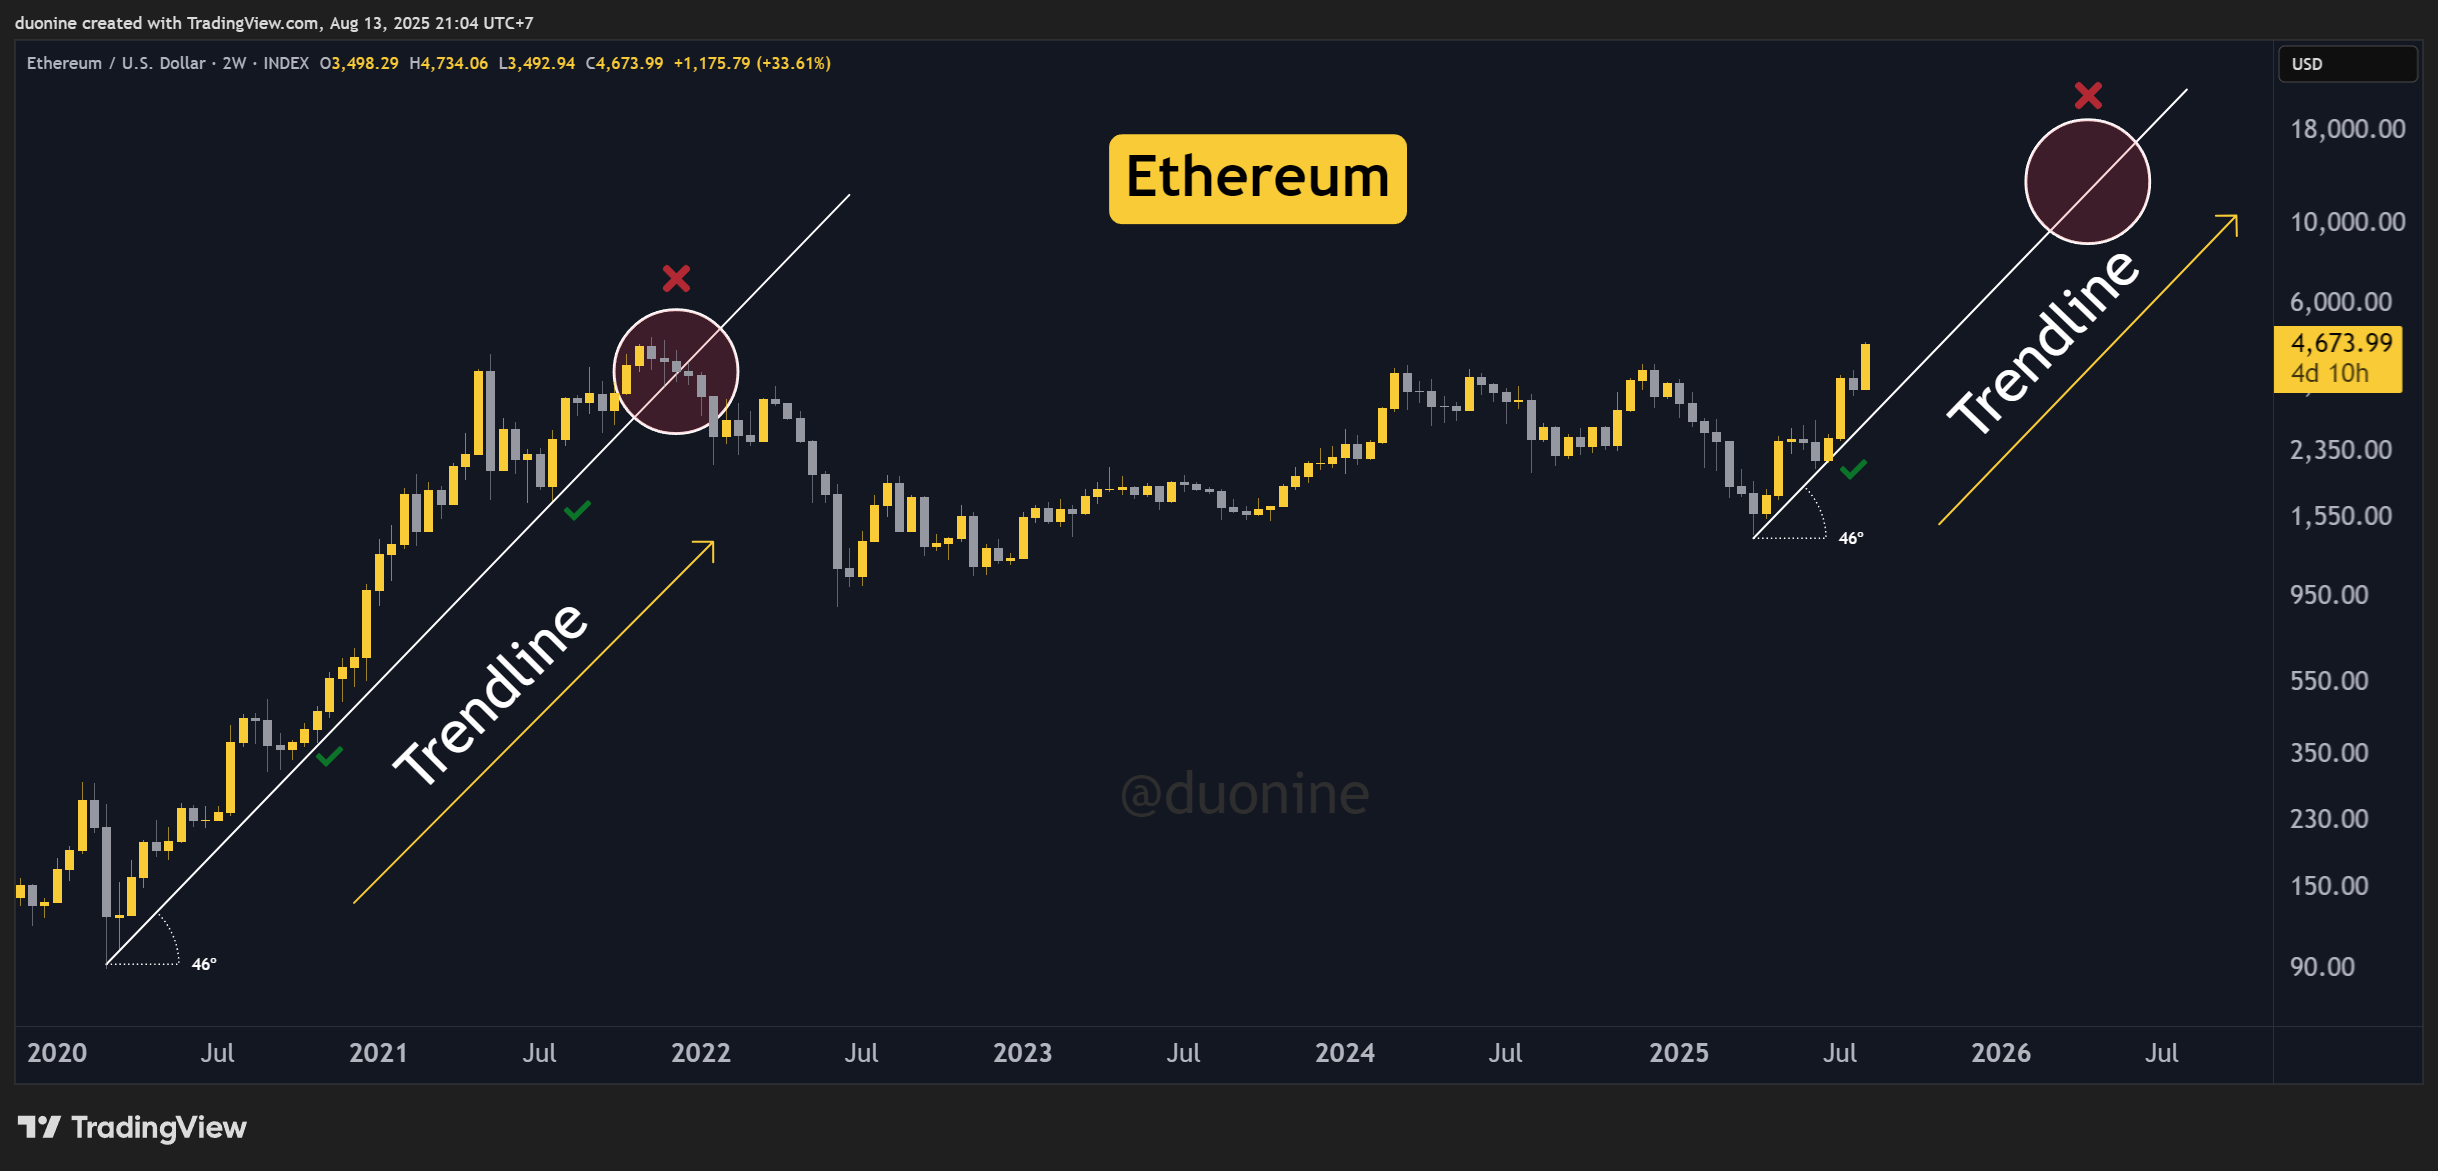
Afterwards, wait!
The worst thing is to re-enter as the price moves higher. Likely you’ll be buying the top at that point. In trading, you do not have to catch the exact bottom or top if you ride the majority of the trend.
If the trend remains strong, each touch of the trendline can also be an excellent buy opportunity. I can totally see ETH touch its current trendline once or twice before it tops.
Interestingly, the angle of the current trend matches the rally from 2020-2021. The next few months look very promising for Ethereum.
ETH Price Targets
Here are my price estimates based on the associated bias:
Bearish: 6k to 7k
Neutral: 9k to 10k
Bullish: 12k to 15k
A price of about 7k is realistic, 10k is less likely, but still possible. Beyond 10k, Ethereum needs some serious catalysts as that would bring its market cap to over $1 trillion dollars.
Remember that Ethereum pumping will also pull up most altcoins. The same, but in reverse, after it tops. Most altcoins will crash harder once the Ethereum top is in. Be sure to exit most altcoins by then.
Where will Ethereum top? Reply in the comments with your best guess and don’t forget to subscribe!
This newsletter is made possible with the generous support of our Patrons and partners. Upgrade your experience by becoming a Patron for lifetime access to our exclusive private alpha! Details are available on our Patrons page. All info is provided for educational purposes only and is not financial advice.
the most valuable 10$ dollars i ever spent , tnx duo
This is very clear, actionable advice - thank you!