Top 5 Reversal Patters in Crypto!
If you spot them early, you can print.
Price action moves in similar patters. We can also call them fractals. They repeat over and over again.
Here are the top 5 most common reversal patters and their key features!
Reading a chart is an art form. This improves with time and it can help you spot market changes early. Let’s begin.
Become a Patron for lifetime access to our exclusive private alpha!

There are two types of patters in crypto or any market:
Reversal patterns [Part 1]
Continuation patters [Part 2: Read it here]
This guide focuses on reversal patters and is the first part of a two-part guide tailored to crypto with real examples using your favorite coins and tokens.
Here are the top 5 reversal patterns which are also the most frequent. I analyze each including their key features below.
Head and shoulders (normal or inverted)
Double tops and bottoms
Triple tops and bottoms
Saucer shape or rounding bottom
Spike or V reversal pattern
In order for a reversal pattern to be valid, there are a few prerequisites. If these are missing, then you’re probably looking at something else on the chart.
A reversal pattern requires a prior trend (uptrend or downtrend)
A reversal usually starts after an important trendline is broken
The bigger the pattern in size or time, the bigger the reversal to follow
Bottoms usually take longer to form than tops which are move volatile
Volume is more important on the upside while bottoms have smaller price ranges generally
Head and Shoulders
A normal head and shoulders signals a top. An inverted one signals a bottom. This is probably the most common and reliable pattern.
Key features:
Left and right shoulders, these should be of roughly equal height
The head has to be higher than its shoulders
Clear neckline is defined - sloped upwards at tops, downwards at bottoms
Volume declines on each subsequent peak
Pattern is completed when price closes below / above the neckline
Neckline break happens on increasing volume
Minimum target:
The height of the head projected downward from the neckline break point
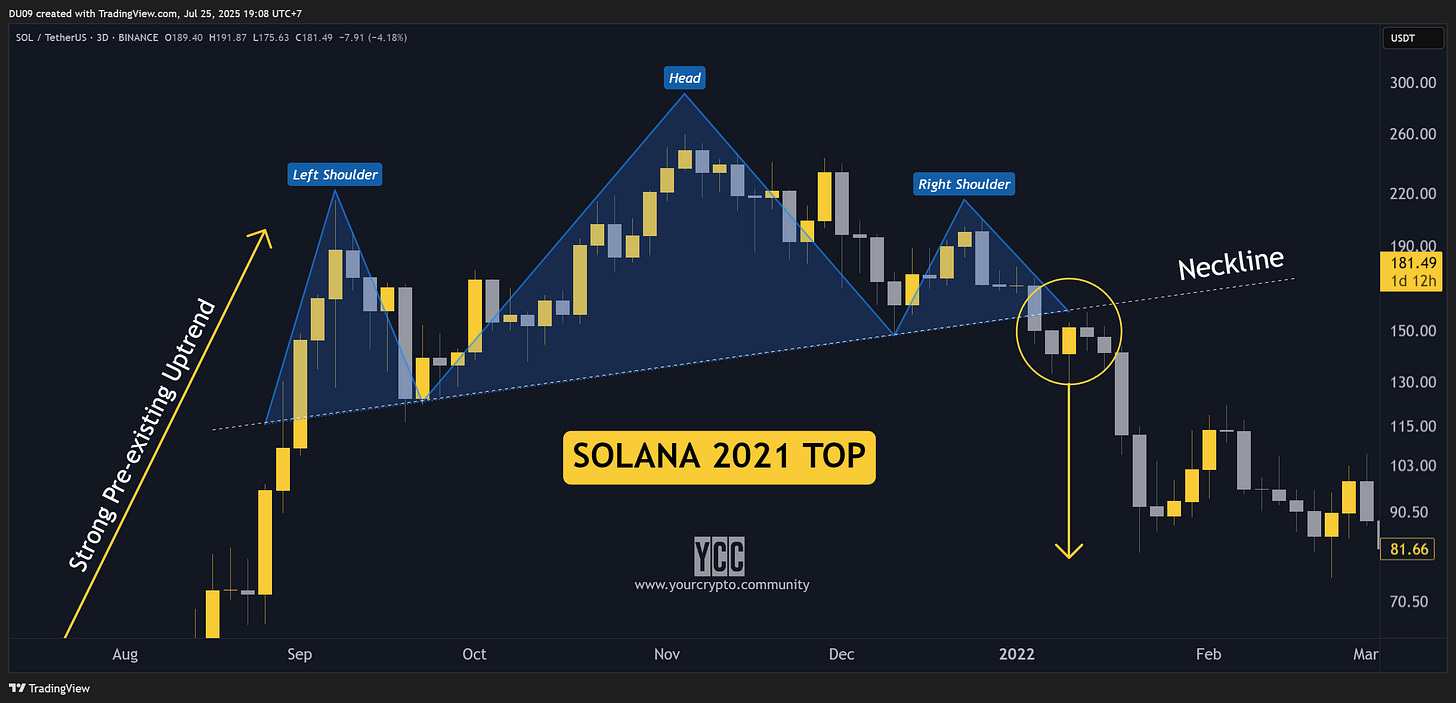
Once the price closes under the neckline, it’s common to see the price re-test the neckline before falling lower. This also happened to Solana in the previous cycle (see yellow circle on the chart) when it topped in November 2021 at around $260.
Solana formed a large head and shoulder spanning over five months. This was a significant reversal pattern. No wonder, a year later, Solana was trading under $10.
The inverted head and shoulders forms at bottoms, its neckline is tilted down, and when the neckline breaks, it should be on strong volume. As the pattern develops, sell volume should decline until the breakout happens.
Double Tops and Bottoms
A common pattern that is most frequent after the head and shoulders.
Key features:
Two clear peaks at about the same level forming a M shape
Volume is lighter on the second peak and picks up on breakdown
Once the base of the formation is broken, the pattern is completed
A re-test of the breakdown level is likely (as seen on the chart)
Minimum target:
The height of the top projected downward from the breakdown point
Interestingly, in our example using the Bitcoin top from 2021, we can also see a classic bull trap (in red) where the price briefly moved higher than the first peak only to reverse and lead to a breakdown.
This Bitcoin reversal pattern took more than a year to complete! In crypto, the higher the market cap of a coin, the longer a pattern takes to form and complete. Everything will happen faster with altcoins of lower market cap (see 4 below).
The double bottom formation would form a W shape and see increasing buy volume upon breakup. The second peak would also see declining sell volume before the breakout.
Triple Tops and Bottoms
A much rarer pattern in occurrence compared to the first two and is a slight variation of the double bottom / top pattern.
Key features:
Three clear troughs at about the same level
Each subsequent trough should be on lighter volume
Volume picks up on breakup
Once the top of the formation is broken, the pattern is completed
A re-test of the breakout level is likely (not on this chart)
Minimum target:
The height of the formation projected upwards from the breakout point
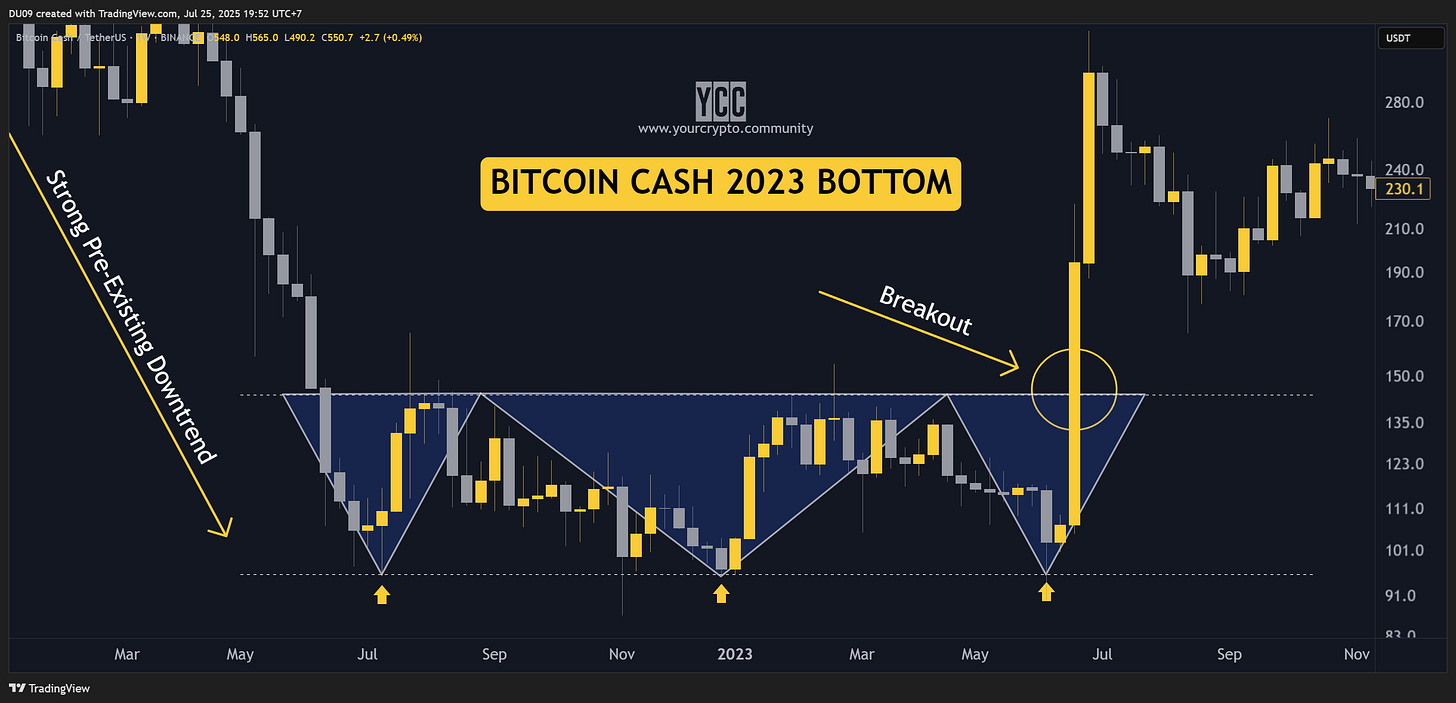
In this triple bottom from 2023, Bitcoin Cash broke out with such velocity and volume there was no time for a re-test of the breakout point. The subsequent rally also exceeded the standard target by a factor of 2x.
Of note, is that this formation also took about a year to form and complete. For the triple top pattern simply review the double top example above and add another peak.
Saucer Shape or Rounding Bottom
While not as frequent, the saucer shape is a slow and gradual turn from down to sideways to up. Measuring when this pattern is completed can be more difficult.
Key features:
The rounding bottom pattern is slow and gradual, but marks a major turn
Volume falls as the pattern forms, but picks up as it reaches breakout point
Once the price escapes the formation, the pattern is completed
A re-test of the breakdown level is likely
Minimum target:
The height of the formation projected from the breakdown point
The example used here is from SPK or Spark. This is a new token launched in mid-June 2025 by the team behind DAI and USDS. After a 50% correction and downtrend, Spark formed a rounding bottom reversal. This took about three weeks to form and the breakout was massive.
Since this was a new token, this reversal patter was quick to form and complete. The opposite of this formation would be a rounding top which manifest similar principles, but is more rare because tops are quicker to form and complete.
Spike or V Reversal Pattern
V reversals are hard to deal with because of how quick they happen. The price literally spikes and there is little time to react.
Key features:
This pattern is sudden and heavy on volume
Hard to spot or react to since transition times are short
The climax in volume indicates a bottom or top
Once the price escapes the V formation, the pattern is completed
Minimum target:
The height of the formation projected from the break point
In crypto, we get the V reversal formation in three instances: 1) there is panic in the market; 2) something goes wrong with a token like a hack; 3) FOMO or euphoria leads to a quick rally and blow off top.
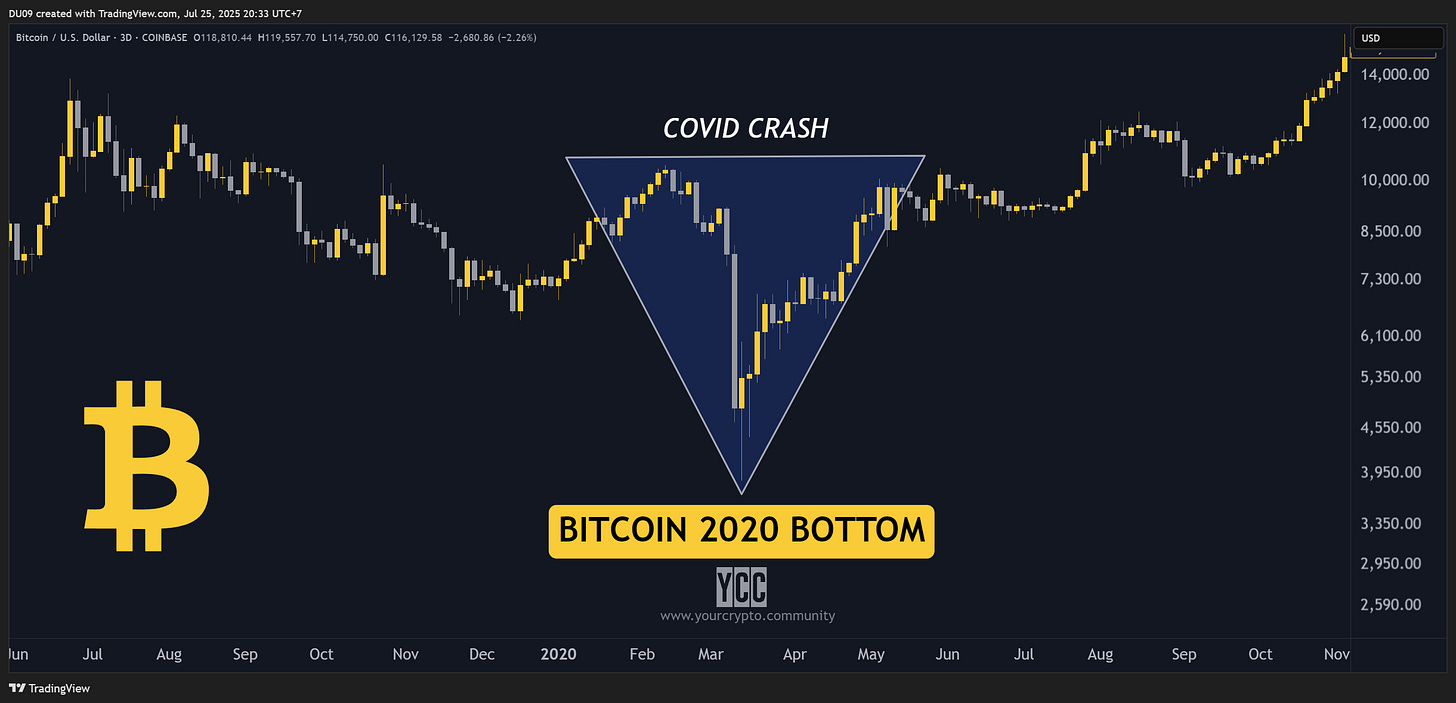
In the given example, we’re looking at Bitcoin’s 2020 price action during the Covid crash. It formed a classic V reversal pattern. The opposite of that is Bitcoin’s 2017 blow off top.
In both cases, the reversal patterns took about three months to complete and saw huge volume, only to fully reverse once the spike in volume faded. This is a hard pattern to trade, but can net huge profits overnight.
Tips to Remember
In technical analysis everything is measured in probabilities. There is no certain outcome and there are always exceptions
The volume profile in a pattern is extremely important and second only to price action. Use volume to get confirmation or validate bias
Such reversal patterns boost your chances of success when trading if you spot them early and confirm the prerequisites
The stated list is not exhaustive. For example, the Adam and Eve or Cup and Handle reversal patterns also occur, but they are seen less often
If you’re inclined to dive deeper beyond this guide read the book Technical Analysis of the Financial Markets by John J. Murphy, a best-seller
Stay tuned for the second part of this guide on continuation patters!
Which of the 5 reversal patterns is your favorite and why? Reply in the comments and don’t forget to subscribe!
This newsletter is made possible with the generous support of our Patrons and partners. Upgrade your experience by becoming a Patron for lifetime access to our exclusive private alpha! Details are available on our Patrons page. All info is provided for educational purposes only and is not financial advice.


Never follow these patterns, but still profitable.
Great work and good read but I miss smart money concepts. Your drawdown on these patterns is too big for small money traders.