
Top 9 Continuation Patters in Crypto!
You only need to follow them to print.

This is the second-part of my guide on trading patterns. If you missed the first part on reversal patterns, head there and check it out first.
Here are the top 9 most common continuation patters and their key features!
These patterns are even easier. All you have to do is check the pre-existing trend and follow it to profit. Let’s begin.
Become a Patron for lifetime access to our exclusive private alpha!

Continuation patterns come in many shapes and forms, but once you know them, they are very easy to spot. Their main characterizing is that they represent a pause in a prevailing trend. Once they are completed, the trend continues.
This is in contrast to my previous guide on reversal patters that indicate a trend is about to change significantly. I recommend you study both guides closely as they complement each other.
Having said that, here are the top 9 continuation patterns. I analyze each including their key features below:
Symmetrical Triangle
Ascending Triangle
Descending Triangle
Broadening Triangle
Flags
Pennants
Bullish Wedge
Bearish Wedge
Rectangles or trading range
Generally, reversal patterns take a longer time to be completed. On the other hand, continuation patterns don’t last as long and are short-term in duration representing a pause in the trend. This is not a fixed rule and exceptions exist.
Triangles
They are everywhere in crypto! The base of the triangle is to the left and the apex to the right where the two trendlines meet. The broadening triangle is an exception.
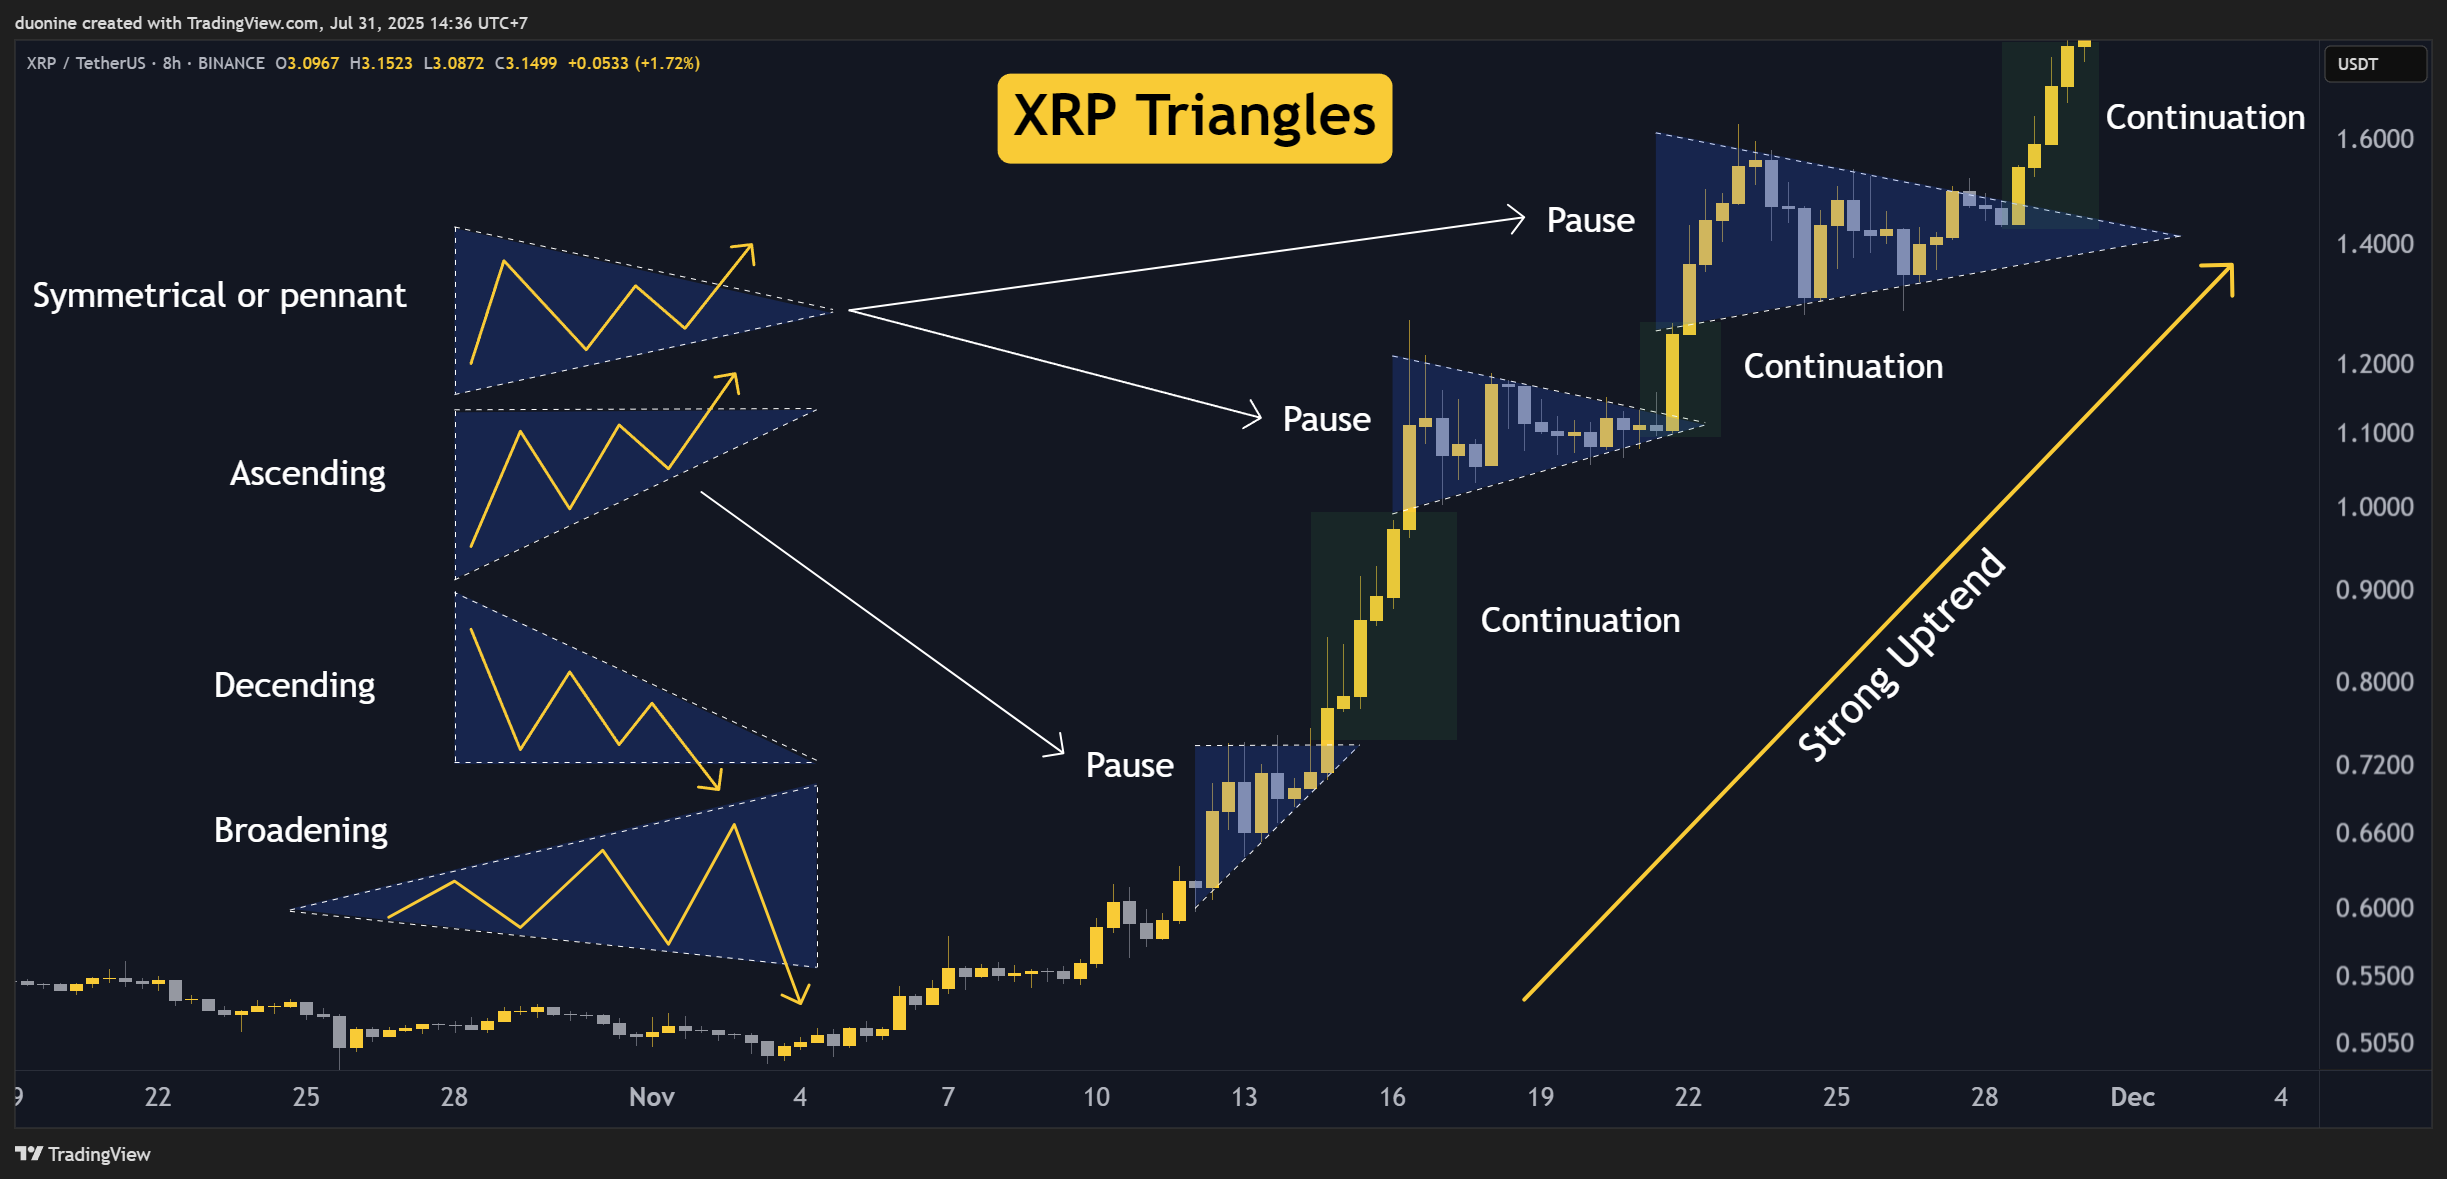
Triangles require at least four reversal points to form which gives us two clear trendlines. The slope of those trendlines determine the type of triangle we’re dealing with. Such patterns usually resolve when the price moves more than 70% within the formation.
As you can see on the chart, XRP formed three triangles on the way up to $3 back in November 2024. They represented a pause it its underlying trend before the price continued higher. Such pauses are great trading opportunities to get positioned.
In an uptrend, you’ll likely meet symmetrical triangles and ascending triangles. In a downtrend or bearish market you’ll likely meet symmetrical triangles, descending triangles, and broadening triangles. Descending triangles can also be seen as market tops.
Broadening triangles or inverted triangles are a rare occurrence and indicate a market moved by emotions rather than fundamentals. Such patters are also know as a megaphone top. The price expands within the megaphone and then drops below it.
Minimum target:
The high of the triangle base projected from the price breakout point.
Flags and Pennants
Very common and usually happen in the middle of a strong trending market representing a brief pause in the trend.
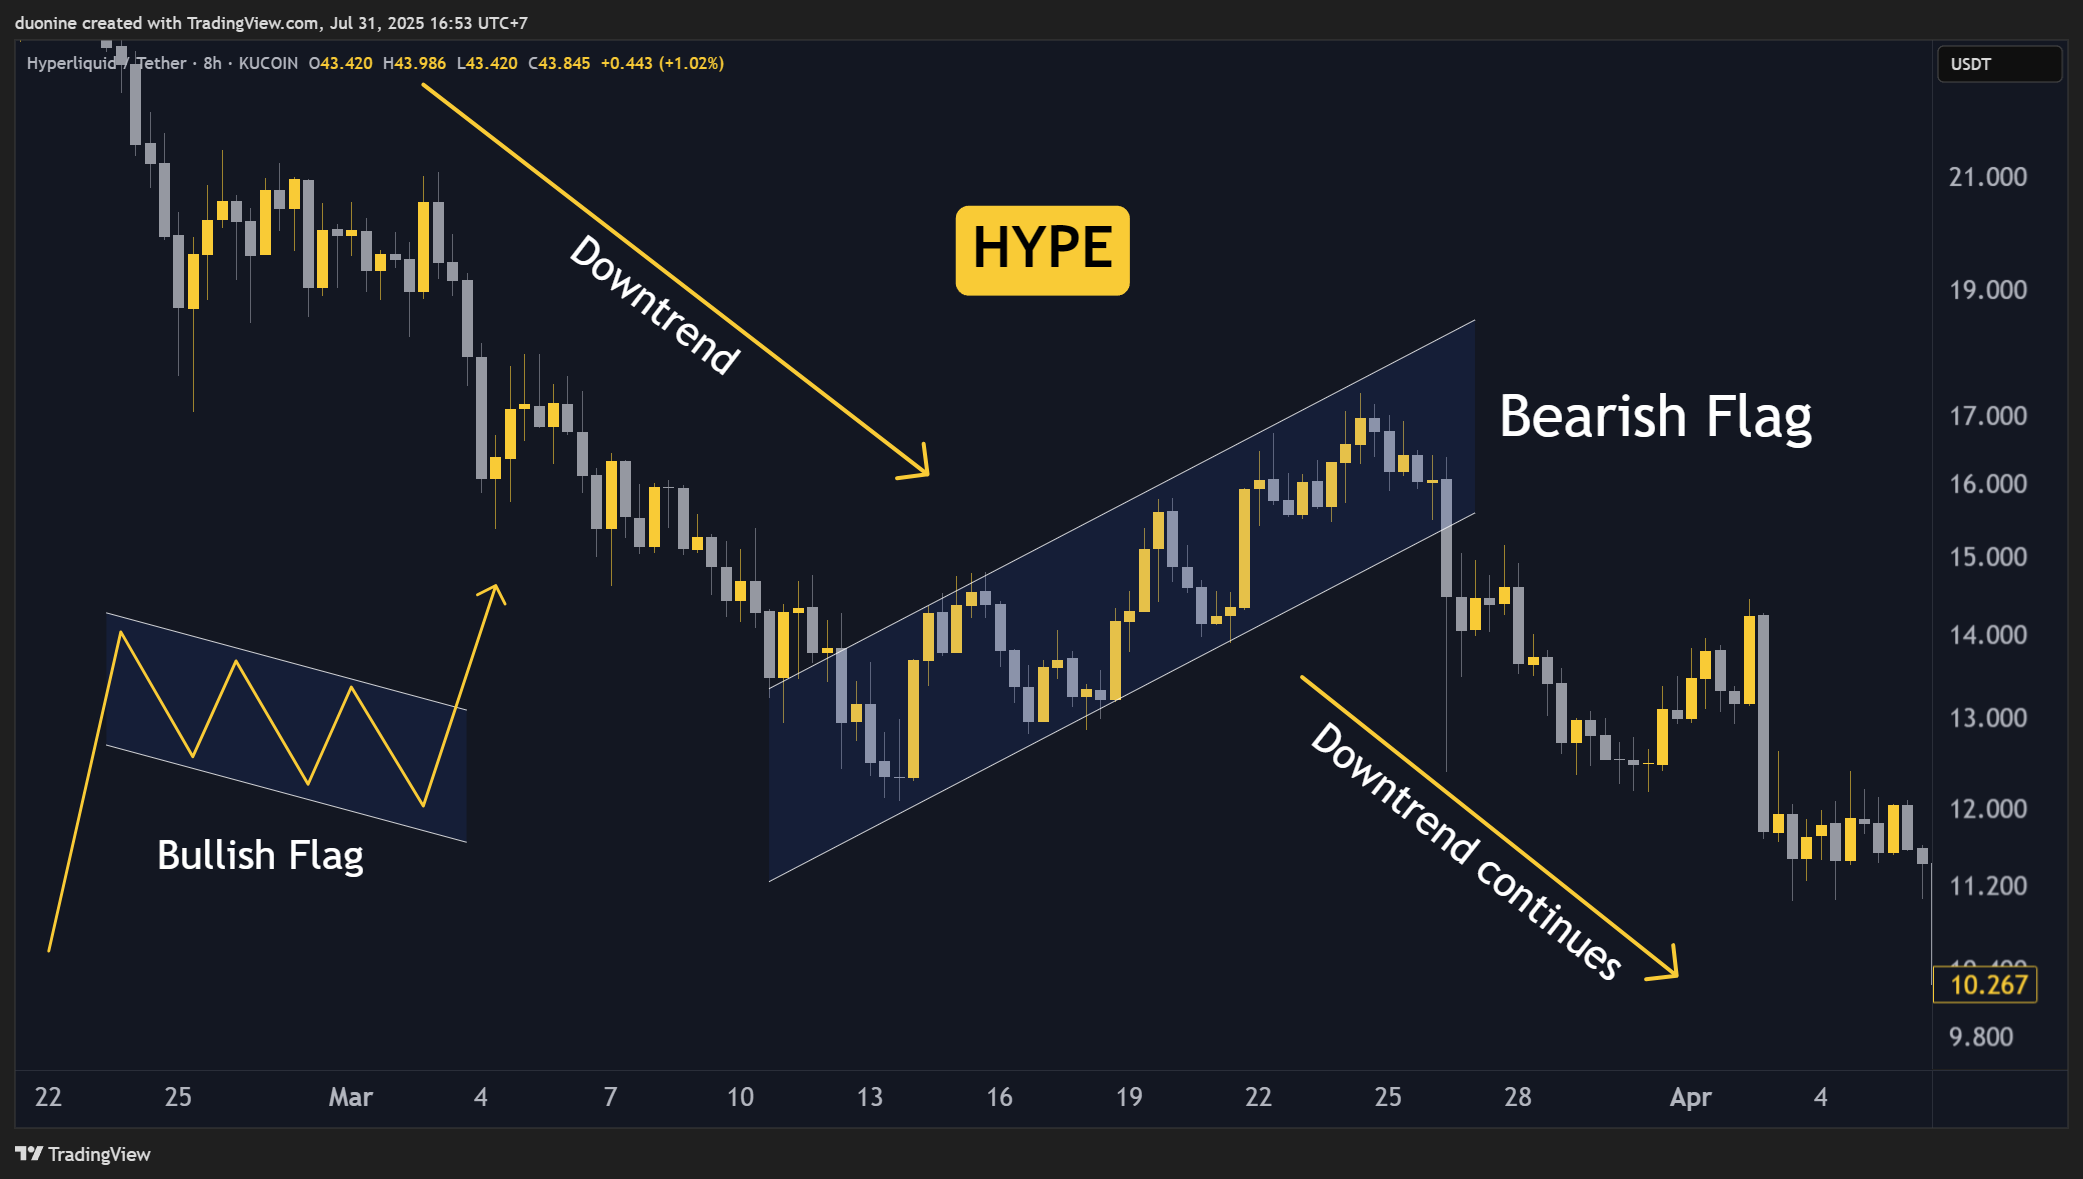
Flags and pennants happen because the market went ahead of itself and needed to catch its breath. They are short in duration and formation. Two pennants can also be seen on the XRP chart I started with.
The difference between a pennant and symmetrical triangle is that a pennant is smaller and follows a strong flagpole price move (representing a prior sharp advance or decline), while a symmetrical triangle is larger and can form in a less volatile trend.
In the above chart, I show a bearish flag on HYPE. These, like pennants, appear near the mid-point of an important trend. Flags should slope against the trend. In our example, the flag is upwards in a bearish market. The reverse applies in a bullish market.
Volume within flags should decrease as it develops then spike upon breakout. The same applies with triangles or pennants.
Minimum target:
The price movement before the flag or pennant is formed will be mirrored after their completion in the direction of the existing trend.
The Wedge Formation
These are similar to a symmetrical triangle where the price moves towards the apex. The difference is that wedges have a noticeable slant to the upside or downside.
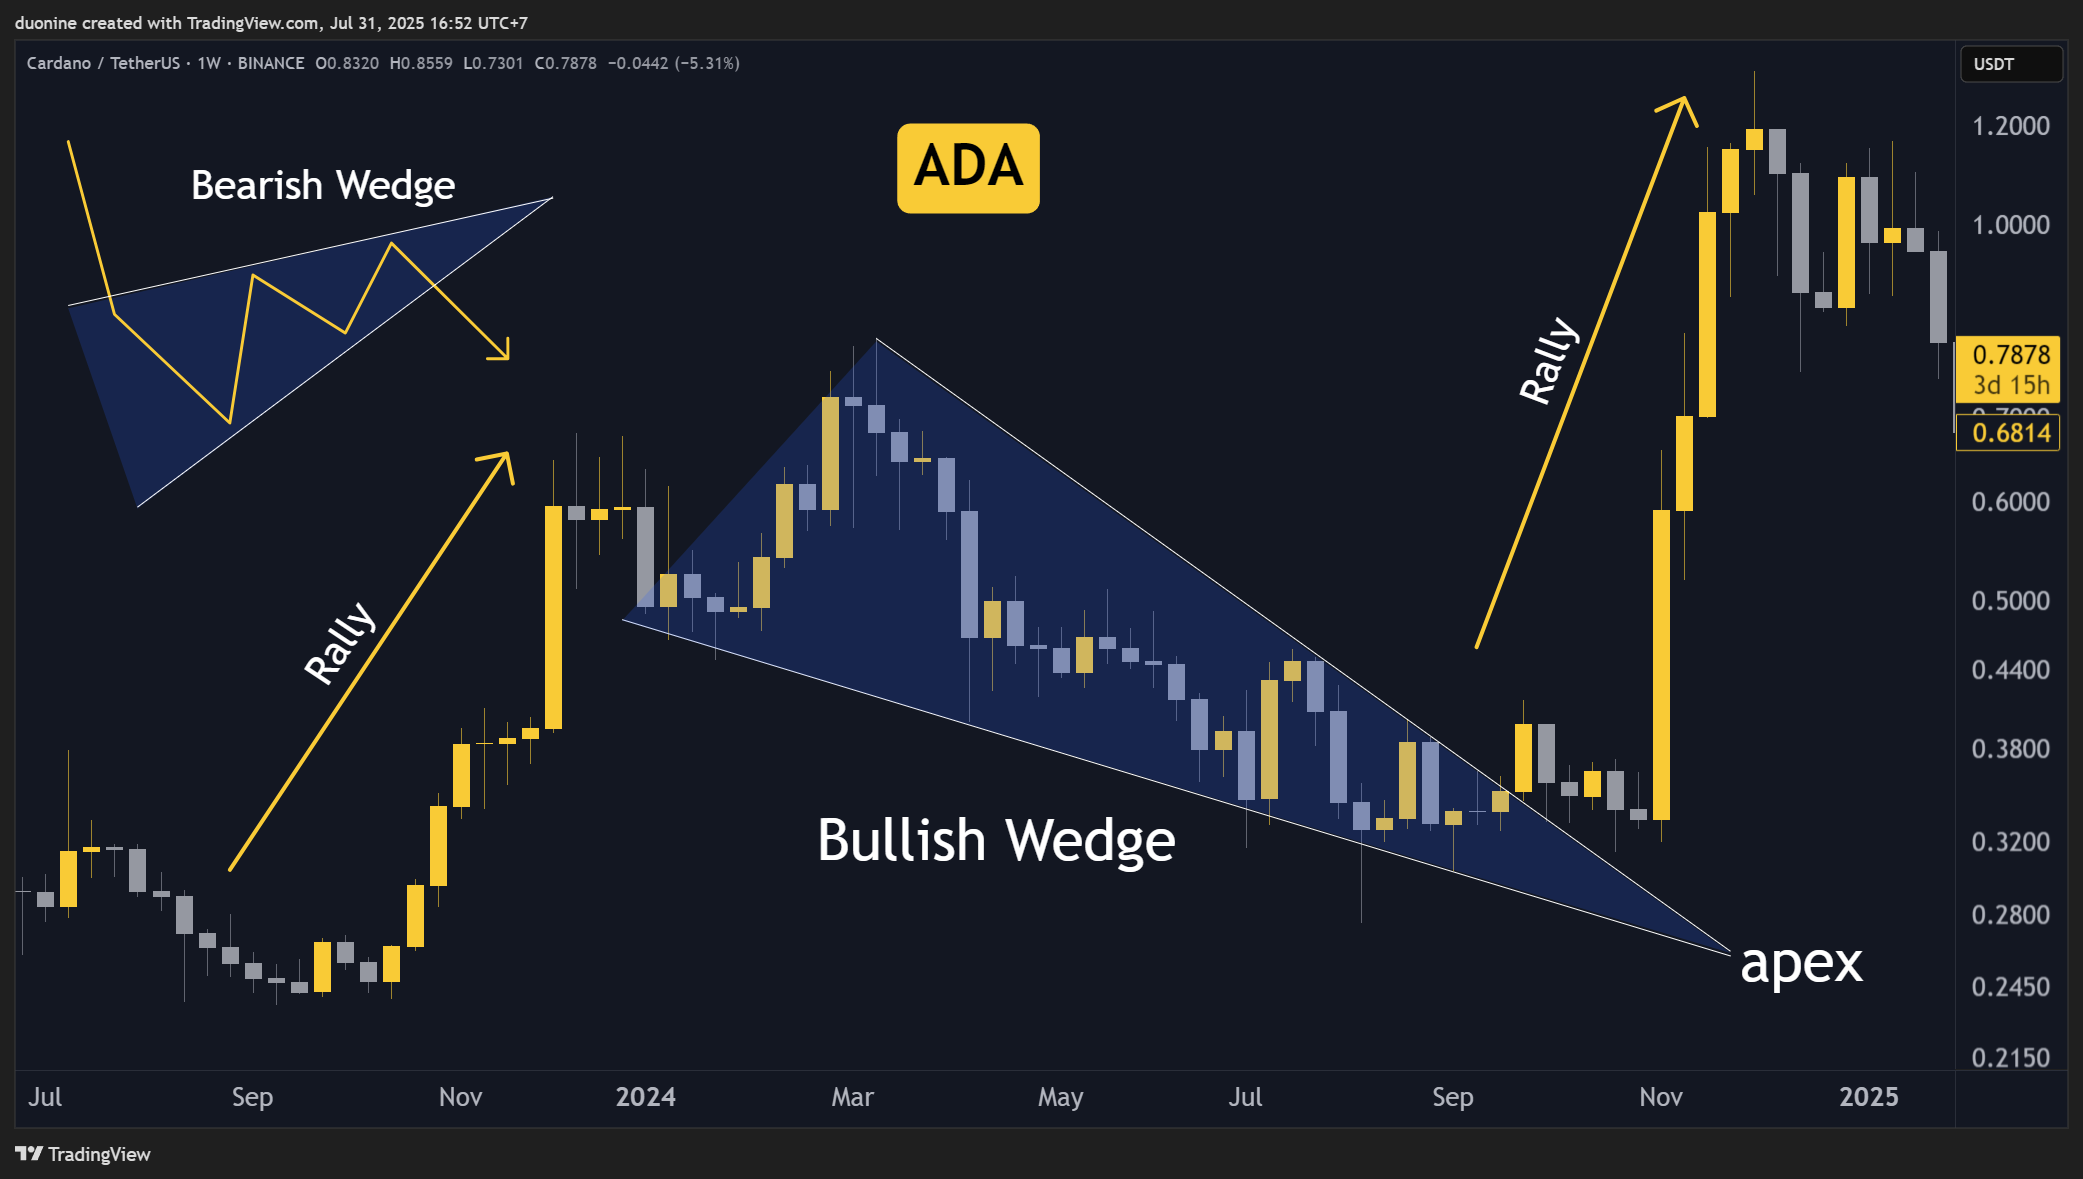
The wedge slant should fall against the prevailing trend like with flags. In our example, this bullish wedge on ADA is called a falling wedge and formed over a number of months and is larger than typical. The opposite of this is a raising wedge in a bearish market where the apex points up.
The volume should decrease as the price approaches the apex and then spike during the breakout. As expected on the ADA chart, the breakout mirrored the prior rally before this wedge was formed.
Wedges can also signal a top or bottom formation, but this is less common. Regardless if a wedge is a continuation patter on reversal pattern, remember that a rising wedge is bearish and a falling wedge is bullish.
Minimum target:
The price movement before the wedge is formed will be mirrored after their completion in the direction of the existing trend.
Rectangle Formation or Trading Range
When the price moves sideways, that’s a clear pause in the trend and should be easy to spot. This is also called a trading range.
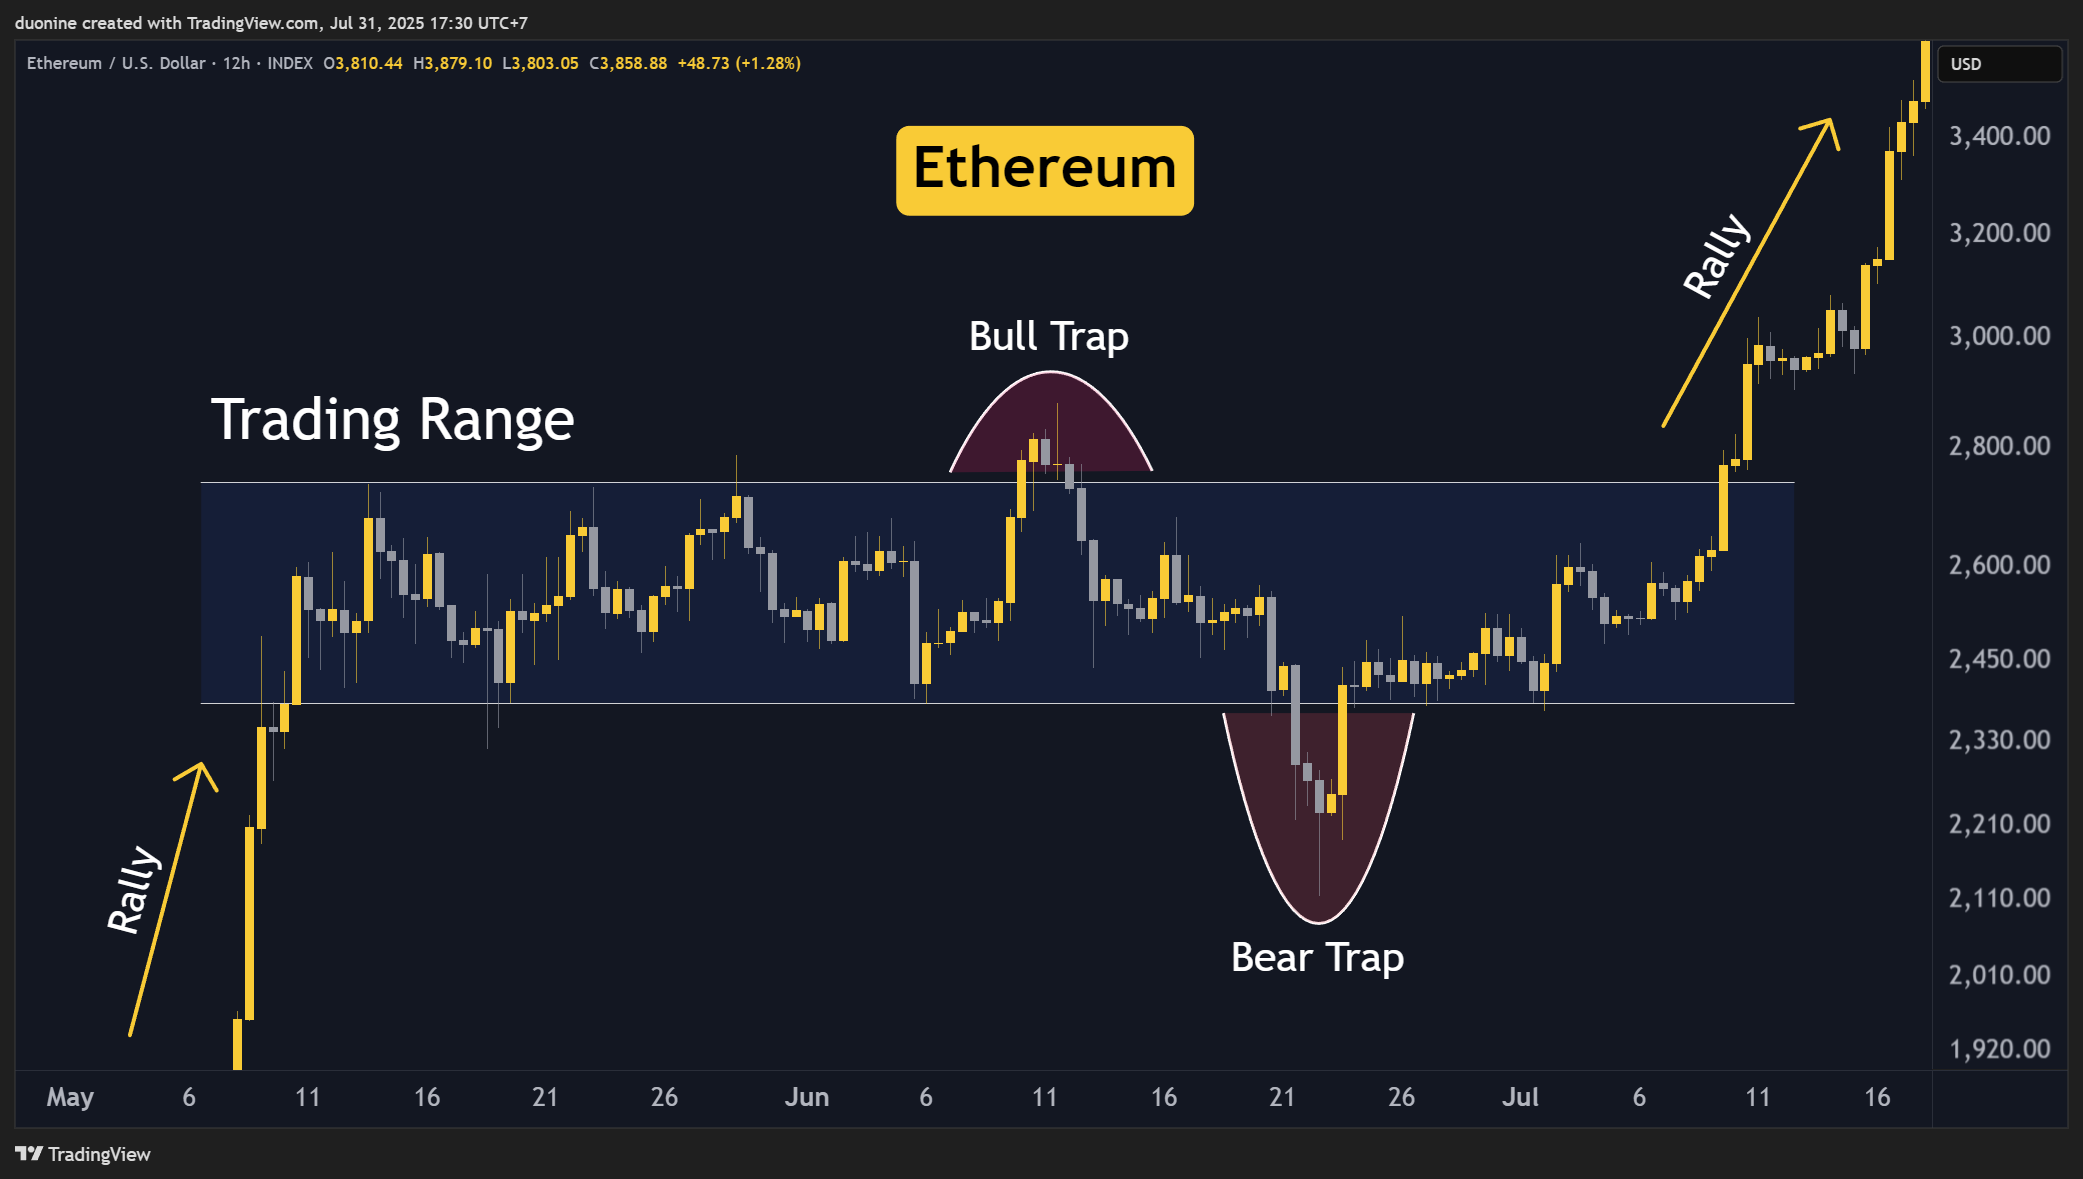
A trading range is a consolidation period in an existing trend when the market pauses to gather strength for its next major impulse in the same direction. This pattern has similar predictive power like symmetrical triangles.
When the price moves decisively above or below the rectangle, the formation is considered completed. However, in the above example using Ethereum’s recent price action from June 2025, we can see that the price did both a bull trap and bear trap before moving decisively higher to continue its uptrend.
When analyzing this pattern watch the volume closely to see in which direction it picks up as that will hint at how the formation will resolve. If volume is heavy on the buy side, like in our example, the expectation is for a breakout to the upside which eventually happened, despite the two traps.
Minimum target:
The price movement before the rectangle is formed will be mirrored after its completion in the direction of the existing trend.
Tips to Remember
In technical analysis everything is measured in probabilities. There is no certain outcome and there are always exceptions
The volume profile in a pattern is extremely important and second only to price action. Use volume to get confirmation or validate bias
Such continuation patterns boost your chances of success when trading within an existing trend
The stated list is not exhaustive
If you’re inclined to dive deeper beyond this guide read the book Technical Analysis of the Financial Markets by John J. Murphy, a best-seller
Which of the 9 continuation patterns is your favorite and why? Reply in the comments and don’t forget to subscribe!
This newsletter is made possible with the generous support of our Patrons and partners. Upgrade your experience by becoming a Patron for lifetime access to our exclusive private alpha! Details are available on our Patrons page. All info is provided for educational purposes only and is not financial advice.
Good content. Based on these wonderful patterns, applying to Total 3, hope things are looking good.