
When Should You Buy the Bottom?
This chart is a must have in your watchlist.

There is a key chart that I want to draw your attention to which tracks liquidity movements in the crypto market. That can give you an early signal before the market changes.
I’m talking about stablecoins dominance.
When the market is bullish, stablecoin dominance falls because everyone wants to capture the next pump and they buy various coins. On the other hand, when the market is bearish, everyone is running to safety and sells their coins for stables. This pushes their dominance up, like today.
Let’s have a closer look next.
Important: YCC subscriptions will be updated as of March 1st. If you’re on the fence about a paid subscription, this is your opportunity to lock in the best price at $7.5 per month (yearly plan). Just click on the below button!
Become a Patron for lifetime access to our exclusive private alpha!

In early February, I covered 10 charts that can help you find a bottom. This one is close to number 9 on that list, but with a twist.
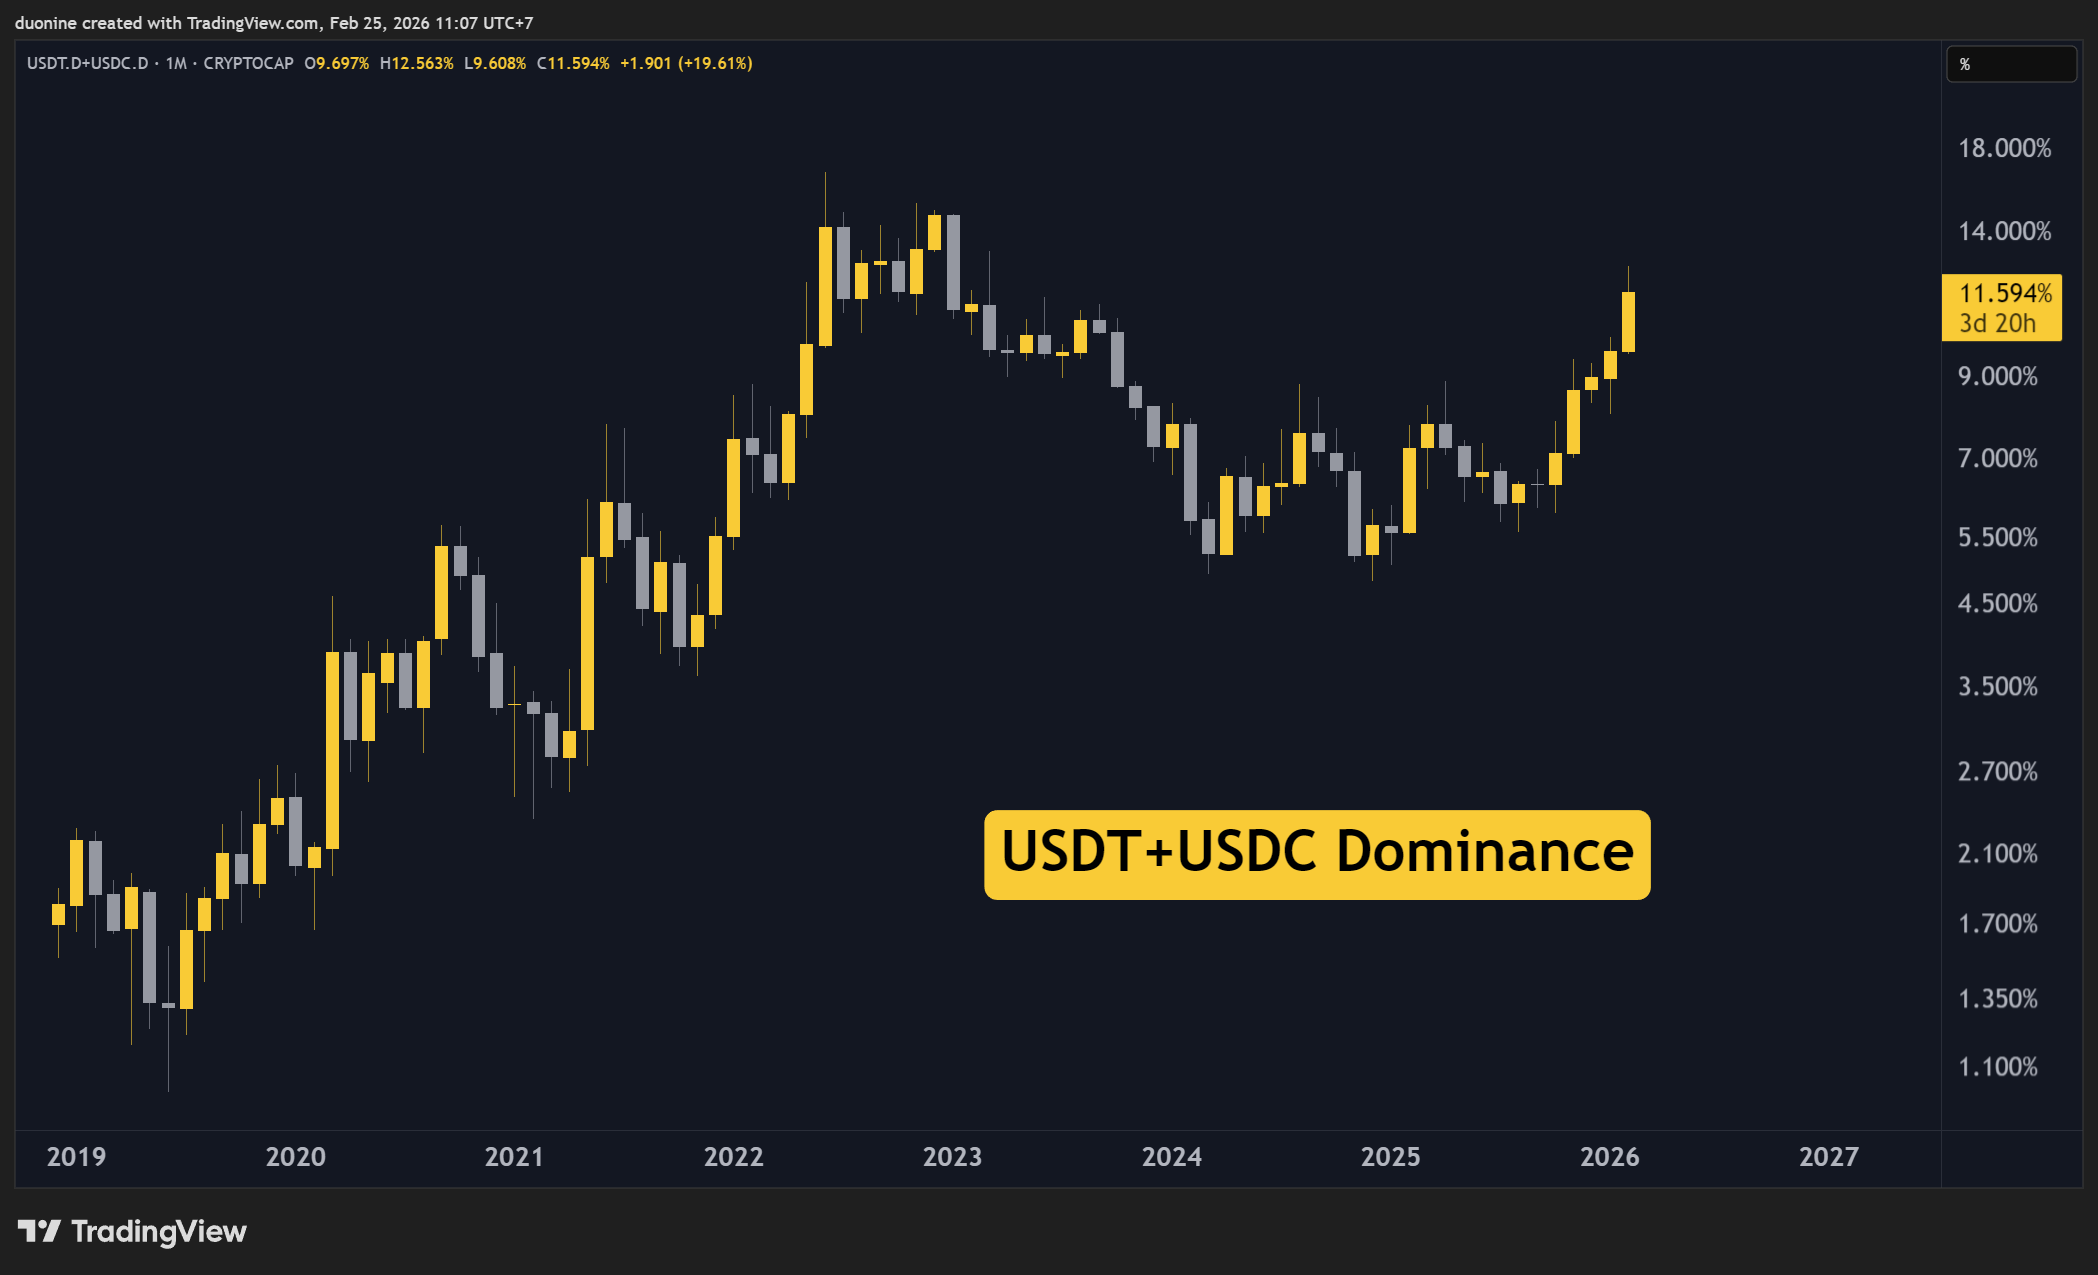
You can add up all the biggest stablecoins together to get a comprehensive view of the overall stablecoin liquidity in the market. For the purposes of this article we will use USDT and USDC as seen below.
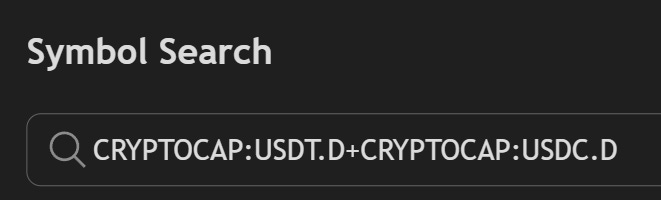
If you want to create the above chart, simply open the search bar for symbols in TradingView and type this: CRYPTOCAP:USDT.D+CRYPTOCAP:USDC.D
As you can see below, the stablecoin dominance has moved above 11% after breaking away at 8%. That breakout happened just after the BTC top in October 2025. That was a key signal to sell and stay in cash.
The first major resistance of this rally is at 15%, still some distance away from today’s levels. This tells us a few things already:
The Bitcoin bottom is not in, we have to wait a few more months at least
The search for a bottom is accelerating based on this price action
Once a bottom is found, reversal can take at least six months to materialize
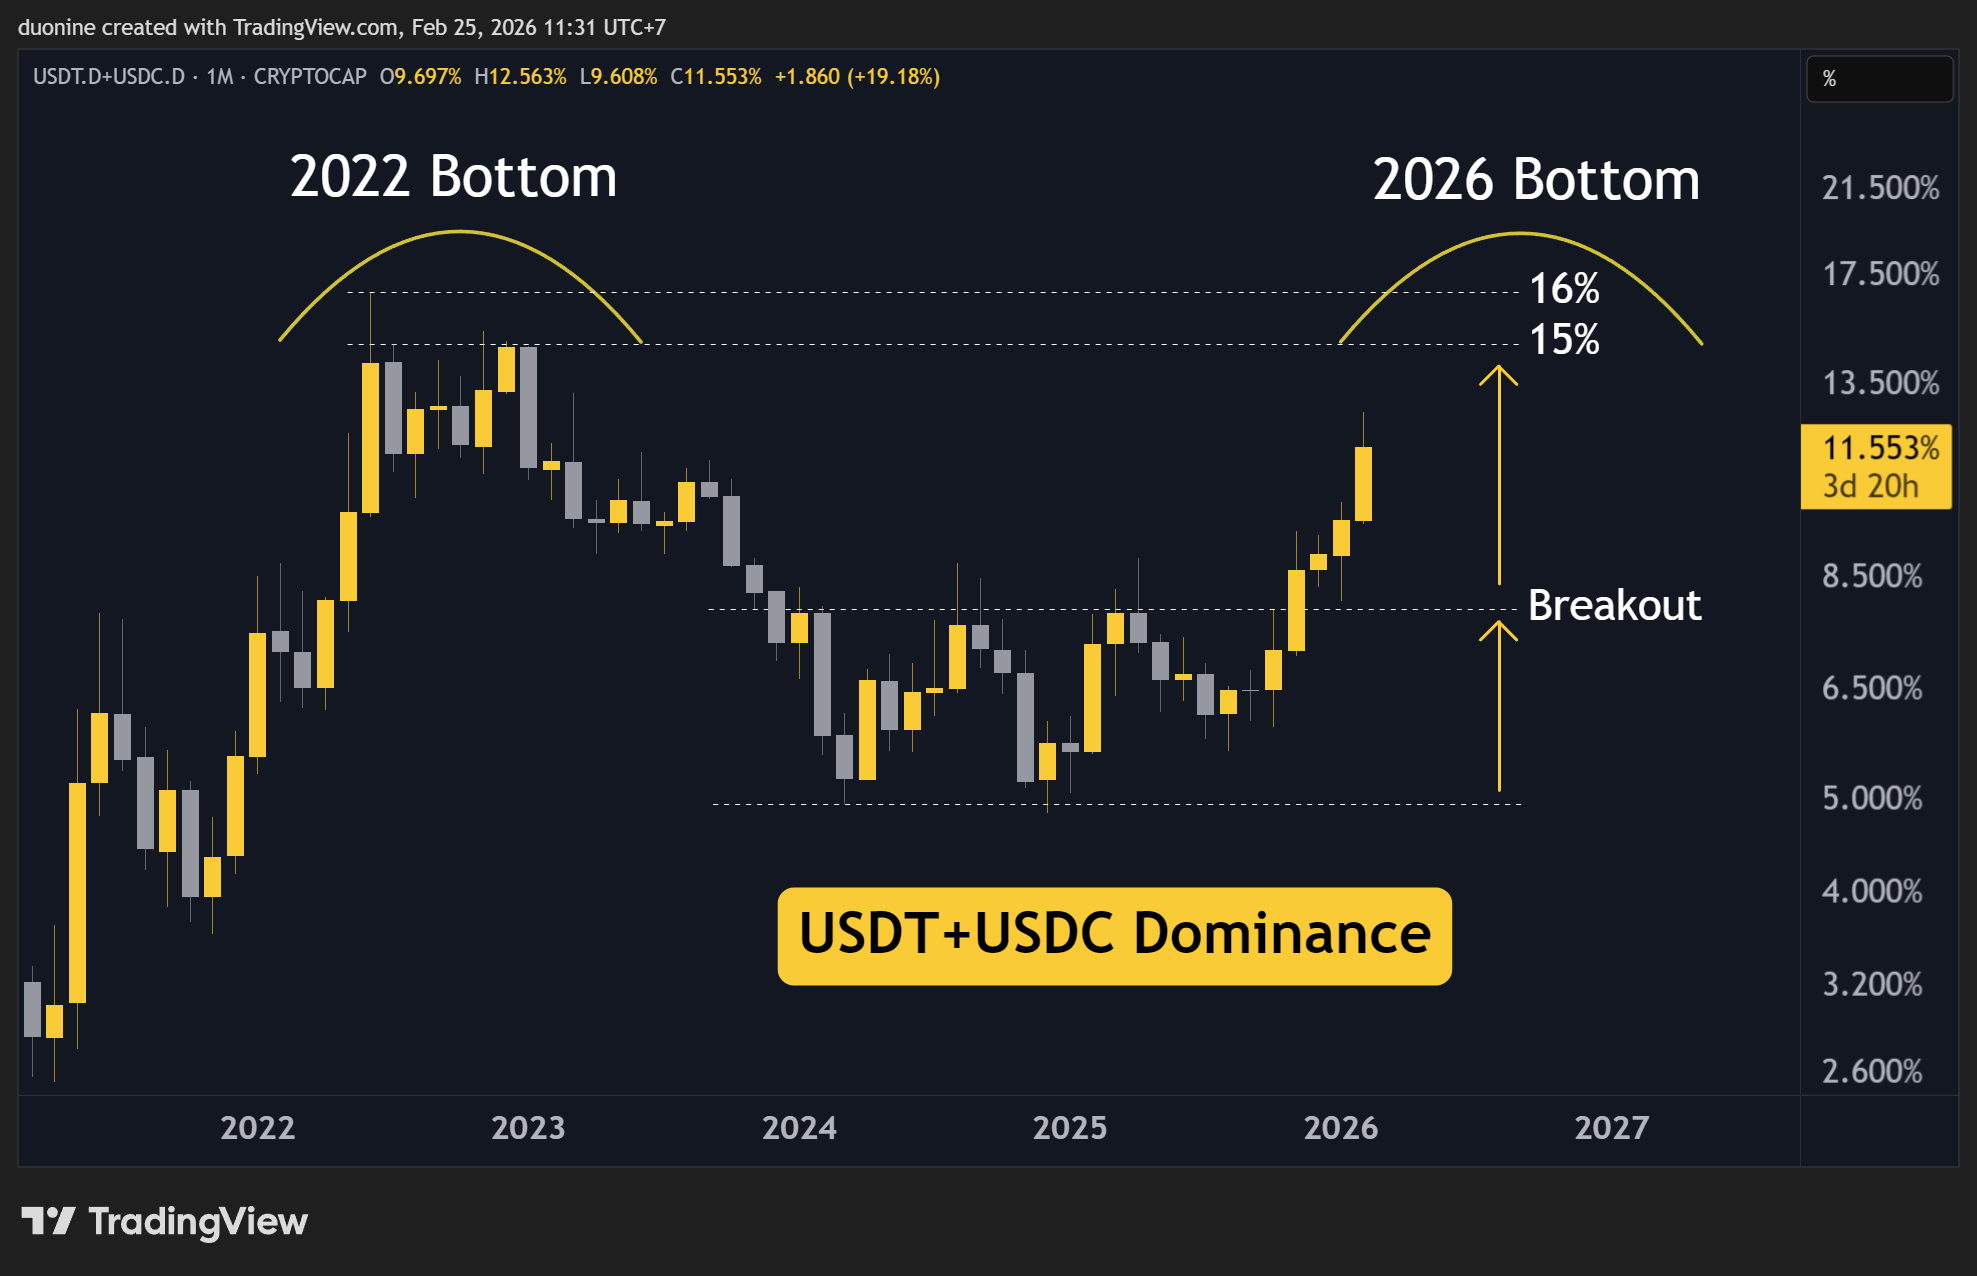
Therefore, you should not rush to buy here. This chart, like the others I covered in the past, suggest that it is too early to do so now. At the same time, there is no guarantee the stablecoin dominance will stop at 15% or 16%.
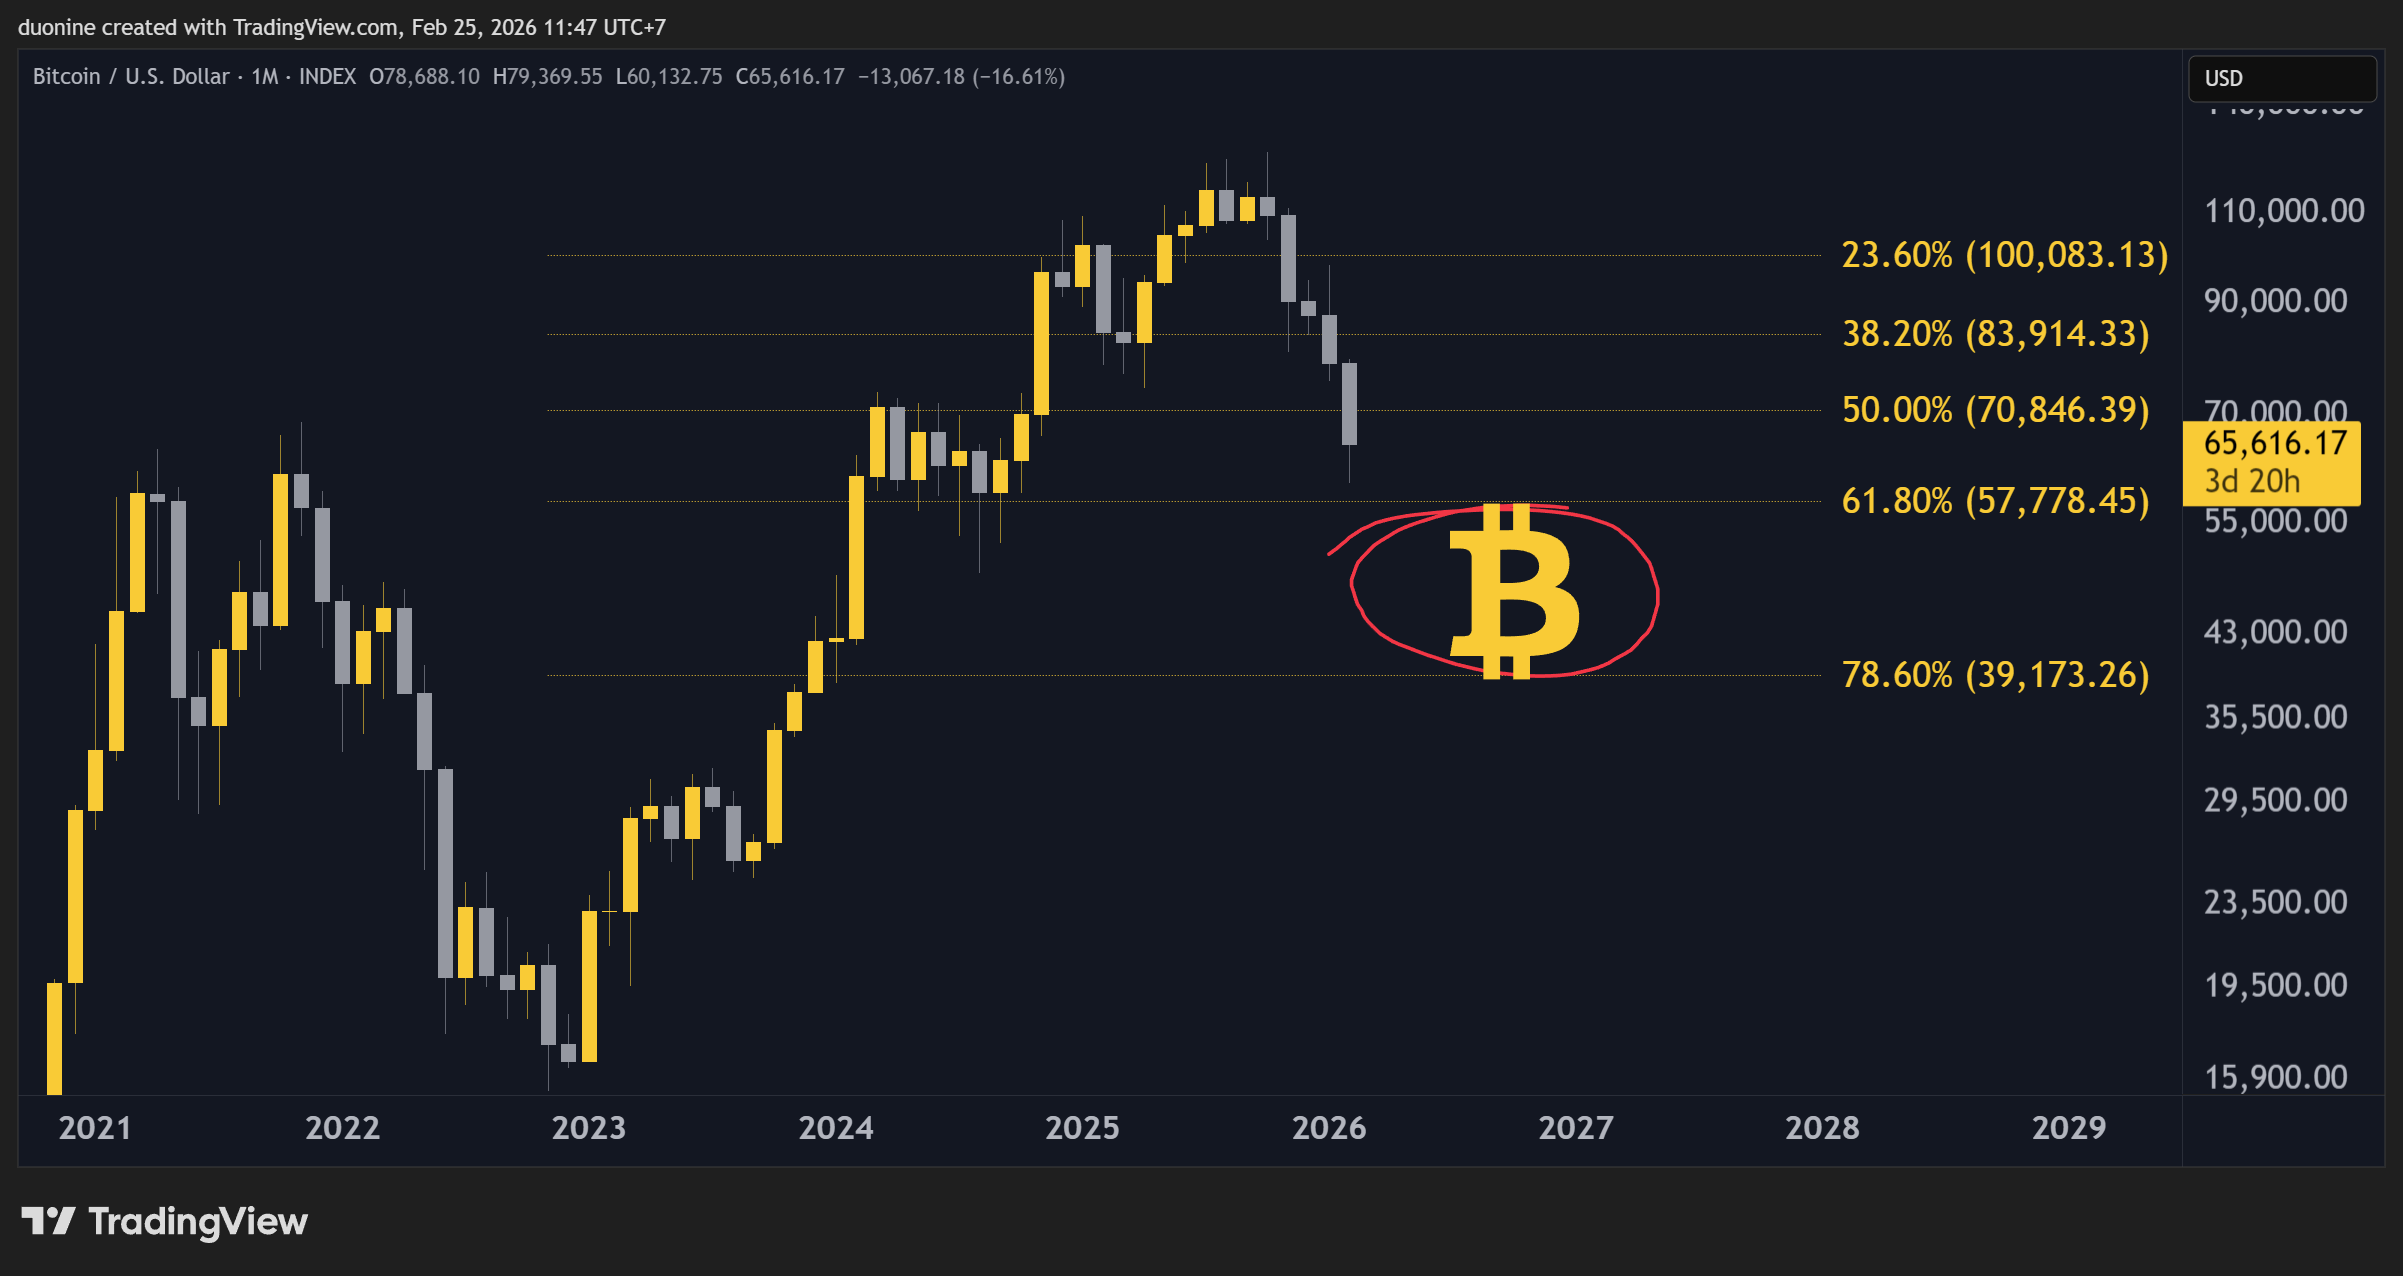
Nevertheless, those levels coincide with a key demand area that is likely to reverse the current downtrend in Bitcoin’s price. Since more and more people are sitting in cash, they will eventually be tempted to deploy it if the price is low enough.
I still believe the area between 50k and 30k is a prime buy zone. However, what we’re missing in this bear market is a clear relief rally. It’s been a non-stop downtrend for almost six months.
In previous cycles, even if we had a bear market, we still got a month or two of bullish price action. This may be expected somewhere after March with a bottom forming as we approach October. This scenario assumes new lows in the second half of 2026.
We will probably have a good idea where this market is going by the start of summer. Hopefully we get a nice relief rally until then as the alternative is quite bleak, but may bring about a bottom faster.
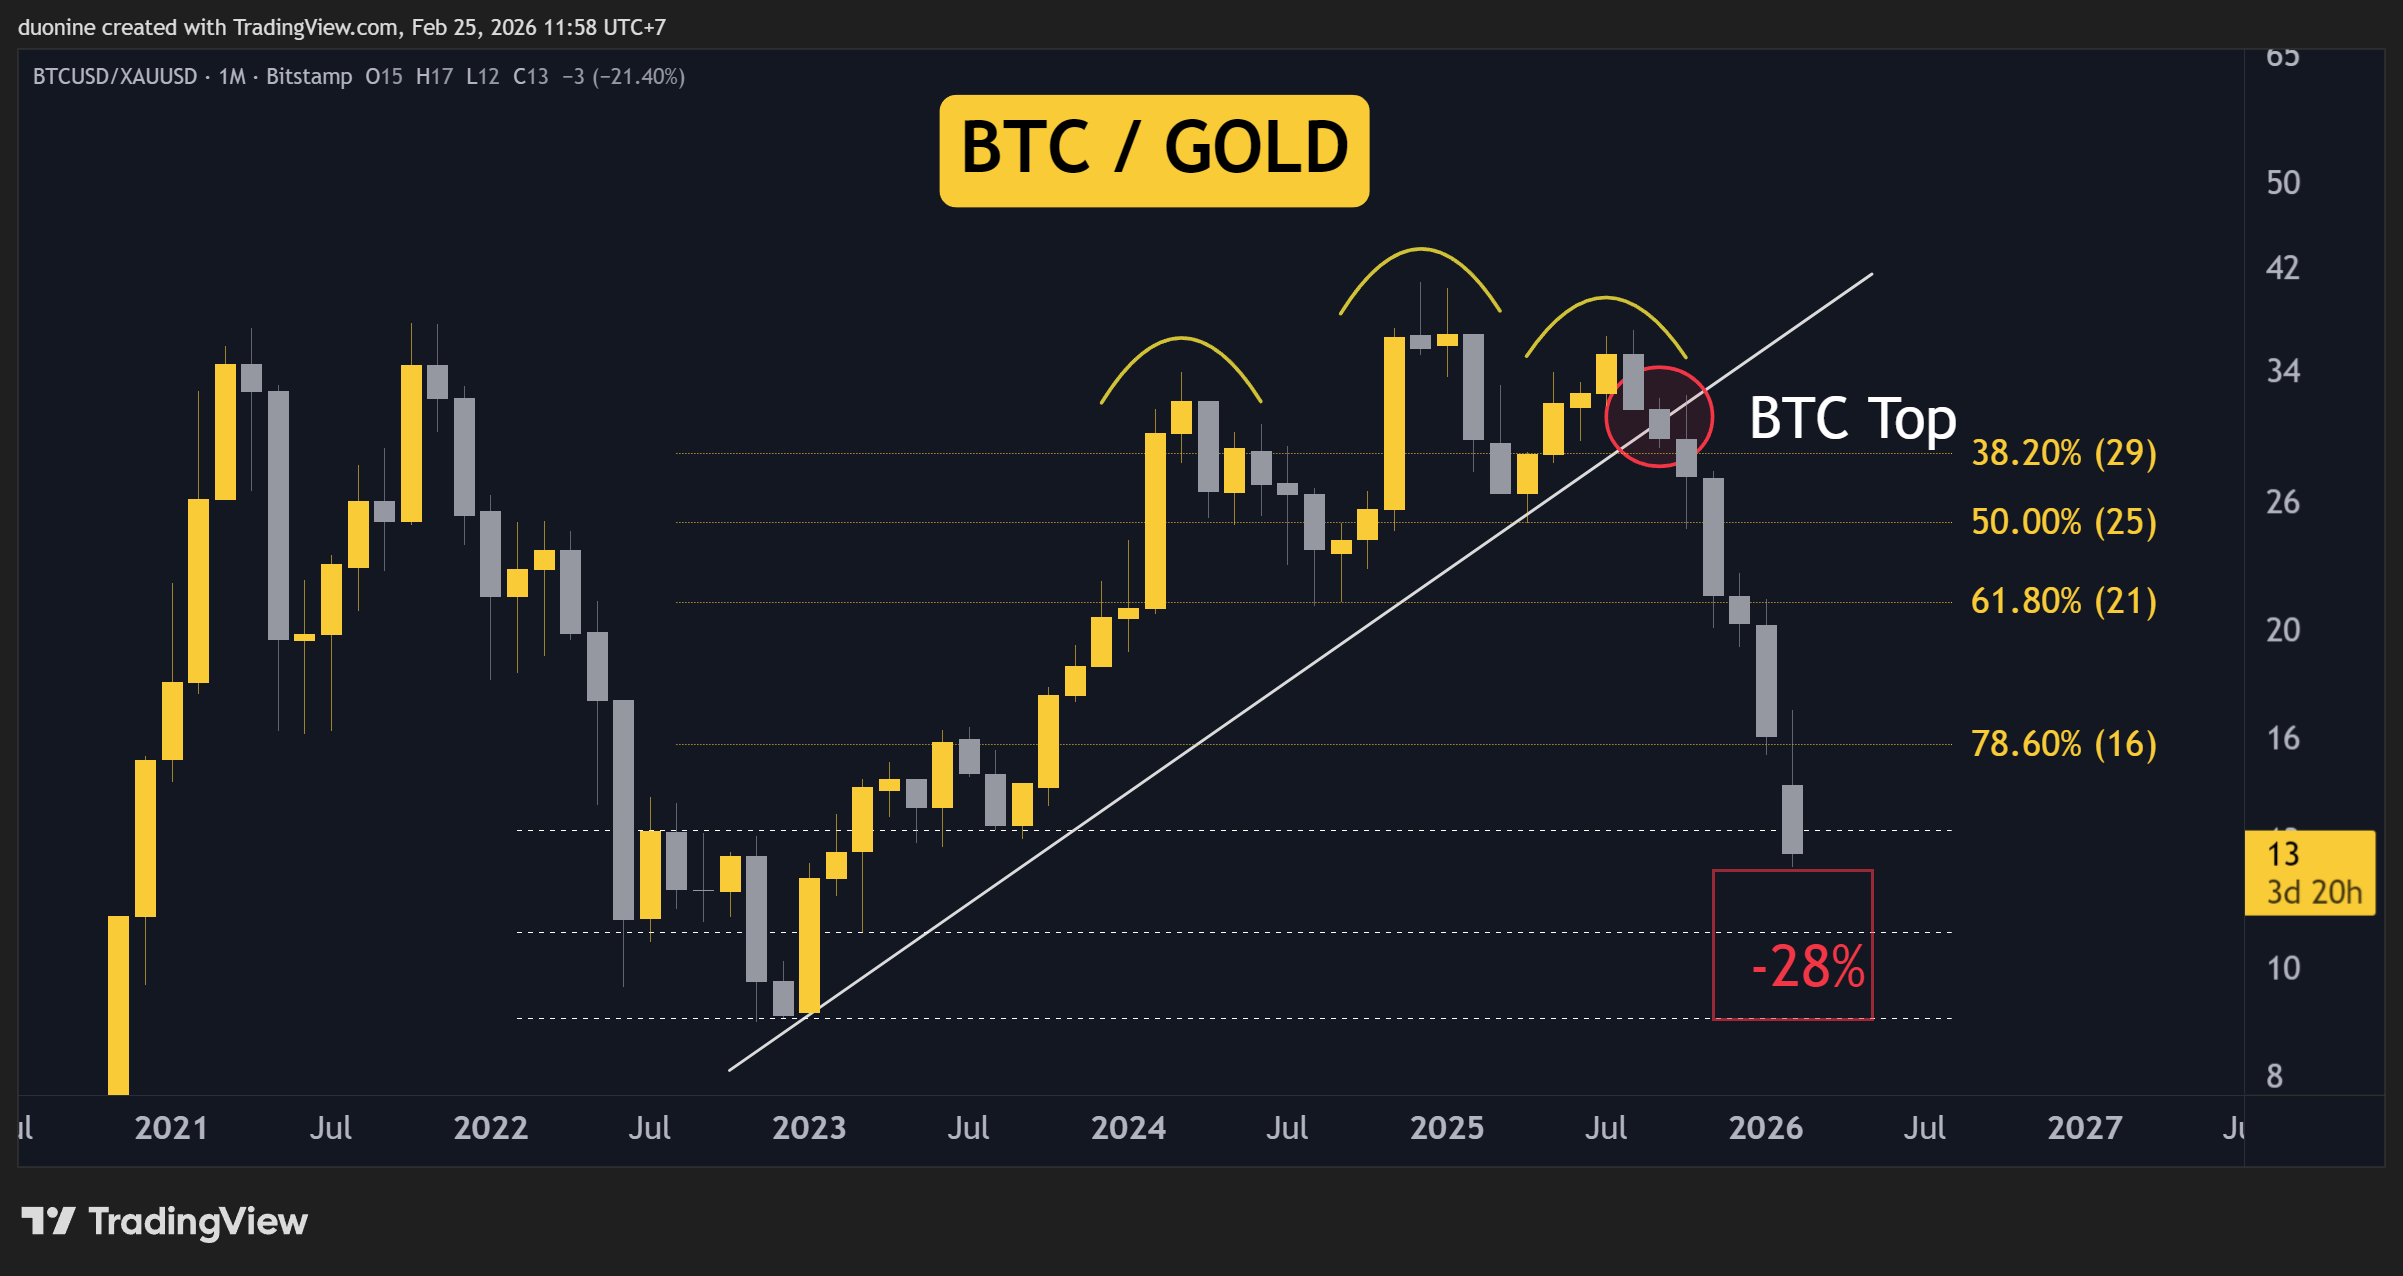
I don’t believe we have reached max pain yet across the markets. That stage is still ahead of us and this BTC/Gold chart may hint at it. Bitcoin can fall almost 30% more against Gold before a bottom. That will surely reach max pain levels.
Exciting times ahead if you plan to top up your Bitcoin bag. Whatever you do, don’t get scared. That’s how the whales shake the coins from your hands and put them in their pocket. Then they send this market to new highs. Don’t fall for that trap.
Stay optimistic.
This newsletter is made possible with the generous support of our Patrons and partners. Upgrade your experience by becoming a Patron for lifetime access to our exclusive private alpha! Details are available on our Patrons page. All info is provided for educational purposes only and is not financial advice.
I meant Gold
Holding my bag of gold will go much higher over time.